Market Wrap: Stocks, Bonds, Commodities
Wall Street indices were higher on Friday with modest gains from heavyweight stocks, pushing major indexes to all-time highs.
The Dow jones gained 89.08 points (0.25%) to 35,819.56, while the Nasdaq rose 50.27 points (0.33%) to 15,498.30, s&p 500 advance 8.96 points (0.19%) to 2,297.19.
MSCI’s index of Asia-Pacific stocks outside Japan is fell 0.43% to 808.28 levels. Australian index rose 0.64% to 7,370.80. Japanese Nikkei Index gained 2.54% to 29,627.00.
European stocks were lower on Monday, with the Stoxx Europe 50 Index falling 0.53% to 4,211.50, Germany’s DAX lost 0.56% to 15,607.35, and France’s CAC slipped 0.26% to 6,787.50, and U.K.’s FTSE 100 down 0.21% to 7,234.00.
Benchmark 10-year U.S. Treasury rose as demand for safe assets grows again, today 10-year bond yields rose 0.55% to 1.564.
Oil rates declined on Monday after China said it released reserves of gasoline and diesel to increase supply and stable price of crudeoil.
Spot Brent crude oil fell 0.41% to $83.38 per barrel. US West Texas Intermediate crude slipped 0.59% to $83.08 a barrel.
The yellow metal traded 0.05% lower to 1783.30 dollars per ounce.
Market Wrap: Forex
The dollar traded higher on Monday as increase of inflation pressure in the United States boosted earlier Federal Reserve interest rate hikes.
Today, the U.S. dollar index measures the greenback against a trade-weighted basket of six major currencies, which gained 0.10% to 94.210.
The Euro US Dollar (EUR/USD) is a widely traded pair that is fell 0.05% today. This left the pairing trading around $1.15560.
The Japanese yen fell against the U.S. dollar on Monday as the stock pushes lower. Today US/JPY is rose 0.26% to 114.280 level.
Another commodity-related currency mixed against the U.S dollar, AUD/USD lost 0.23% to 0.75020, and NZD/USD gained 0.11% to 0.71700 level.
EUR/USD Intraday: Break support level
Our pivot point is at 1.15766
Preferable Price Action: Take short positions below pivot level with targets at 1.15264 & 1.14984 in extension.
Alternative Price Action: Above pivot looks for a further upside to 1.16317 & 1.16611.
Comment: Pair below its 55MA & 20MA and RSI below 50 levels.
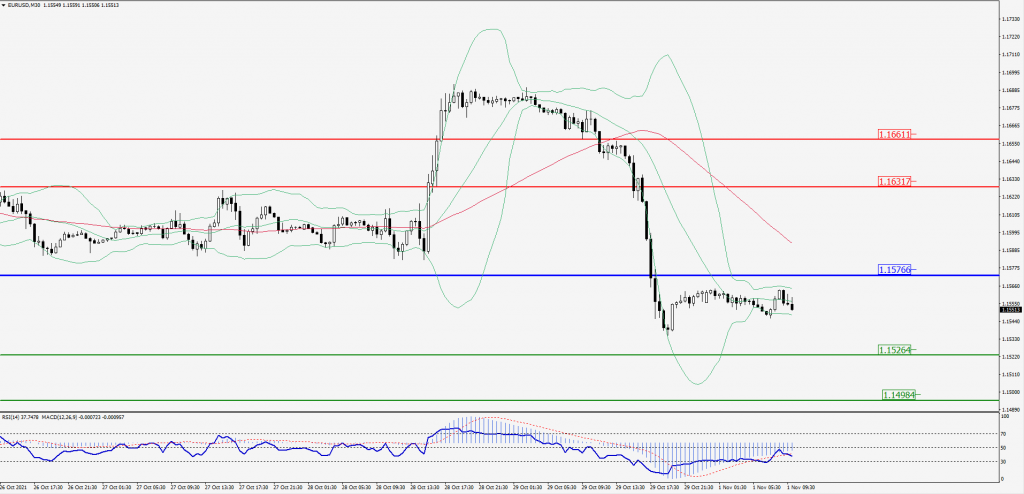
Green Lines Indicate Resistance Levels – Red Lines Indicates Support Levels
Light Blue is a Pivot Point – Black represents the price when the report was produced
GBP/USD Intraday: Resistance at 1.37022
Our pivot point is at 1.37022
Preferable Price Action: Sell positions below pivot with targets at 1.36329 & 1.35967 in extension.
Alternative Price Action: The price above pivot would call for further upside to 1.37728 & 1.38119.
Comment: Pair below its 50MA & 20MA and RSI below 50 levels.
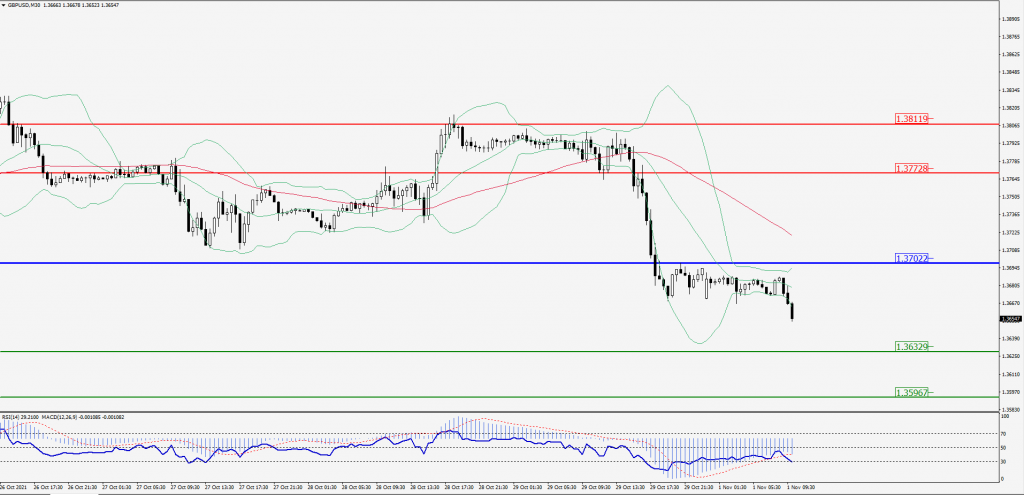
Green Lines Indicate Resistance Levels – Red Lines Indicates Support Levels
Light Blue is a Pivot Point – Black represents the price when the report was produced
USD/JPY Intraday: Break resistance level
Our pivot point is at 114.092
Preferable Price Action: Buy position above pivot with the target at 114.563 and 114.799 in extension.
Alternative Price Action: The downside breakout of the pivot would call for 113.629 and 113.356.
Comment: Price above its 55MA & 20MA and MACD in positive territory.
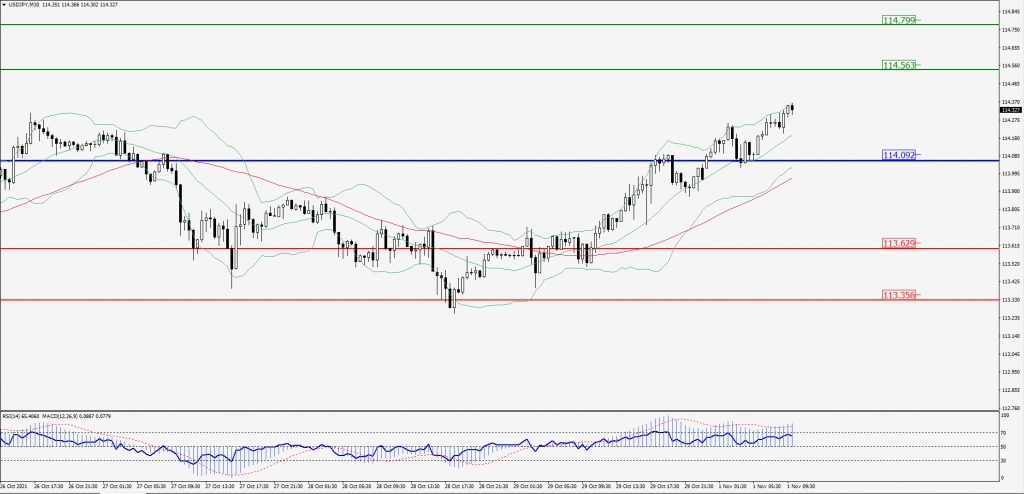
Green Lines Indicate Resistance Levels – Red Lines Indicates Support Levels
Light Blue is a Pivot Point – Black represents the price when the report was produced
AUD/USD Intraday: In a consolidation area
Our pivot point is at 0.75258
Preferable Price Action: Sell Positions below pivot with targets at 0.74827 & 0.74614 in extension.
Alternative Price Action: Above pivot looks for a further upside with 0.75669 & 0.75865 as targets.
Comment: Pair below its 55MA & 20MA and RSI below 50 levels.
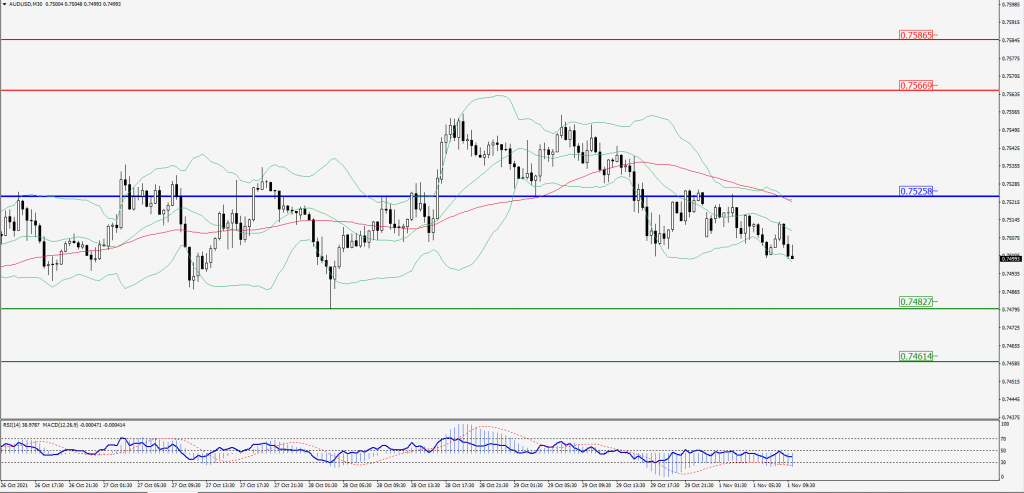
Green Lines Indicate Resistance Levels – Red Lines Indicates Support Levels
Light Blue is a Pivot Point – Black represents the price when the report was produced
CRUDEOIL Intraday: Resistance at 82.97
Our pivot point is at 82.97
Preferable Price Action: Below pivots sell Oil with 80.68 & 79.50 as targets.
Alternative Price Action: Buy crude above pivot with targets at 85.07 and 86.16 in extension.
Comment: Crude is below its 55MA & 20MA and MACD in the flat territory.
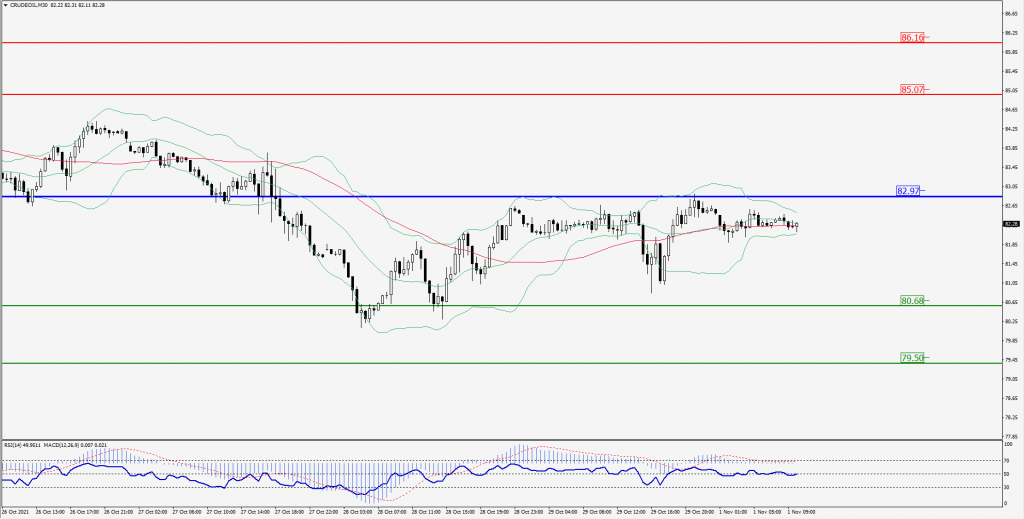
Green Lines Indicate Resistance Levels – Red Lines Indicates Support Levels
Light Blue is a Pivot Point – Black represents the price when the report was produced
XAU/USD Intraday: Resistance at 1794.94
Our pivot point is 1794.94
Preferable Price Action: Further Downside to 1776.86 and 1768.21
Alternative Price Action: If the price gives an Upside breakout of a pivot, then the price extends to 1810.51 and 1818.55.
Comment: MACD in flat territory and price below its 55MA.
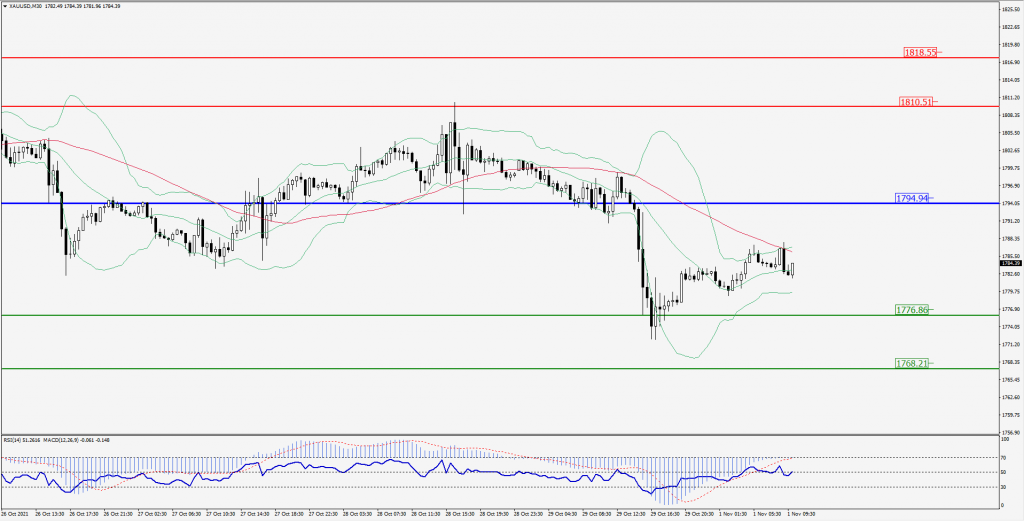
Green Lines Indicate Resistance Levels – Red Lines Indicates Support Levels
Light Blue is a Pivot Point – Black represents the price when the report was produced
Dow Jones Intraday: Support at 35,783.00
Our pivot point is 35,783.00
Preferable Price Action: Take long positions above pivot with targets at 35,963.00 & 36,058.00.
Alternative Price Action: Below 35,783.00 looks for further downside to 35,604.00 & 35,009.00.
Comment: Price above its 55MA and RSI above 50 levels.
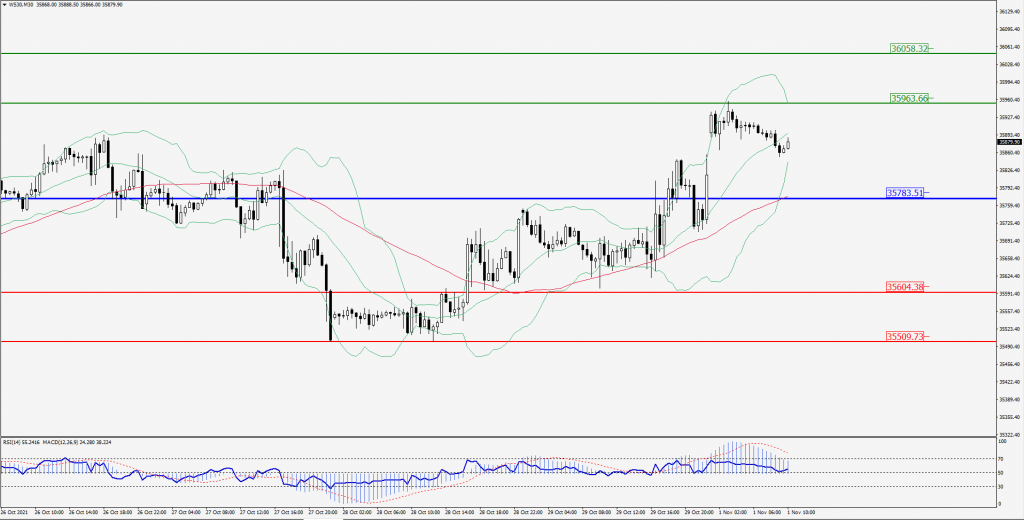
Green Lines Indicate Resistance Levels – Red Lines Indicates Support Levels
Light Blue is a Pivot Point – Black represents the price when the report was produced