Market Wrap: Stocks, Bonds, Commodities
Stock futures inched higher in overnight trading as traders looked ahead to Friday’s May jobs report.
The Dow Jones Industrial Average rose 153.30 points to 33,061.57, the S&P 500 gain 0.99% to 4,221.02 and the Nasdaq Composite add 165.70 points to 13,100.98.
MSCI’s index of Asia-Pacific stocks outside Japan is advance 2.37% to 632.13 levels. The Australian index was higher by 0.48% to 7,145.10. Japanese Nikkei Index advance 1.21% today.
European stocks were positive on Friday, with the Stoxx Europe 50 Index rose 0.93% to 4,297.15, Germany’s DAX advance 0.96% to 16,008.45, and France’s CAC ascend 1.08% to 7,214.17 and U.K.’s FTSE 100 add 0.89% to 7,557.55.
Benchmark 10-year U.S. Treasury fell as demand for safe assets ascend again, today 10-year bond yields positive 0.22% to 3.6190.
Oil prices rose on Thursday by the most in two weeks ahead of an OPEC+ meeting on Sunday, while House of Representatives passage of a bill to suspend the U.S. debt ceiling helped to offset the impact of rising inventories in the country.
Spot Brent crude oil ascend 1.80% to $75.66 per barrel. US West Texas Intermediate crude is up 1.91% to $71.45 a barrel.
The yellow metal gold is decline 0.01% to 1,995.40 dollars per ounce.
Market Wrap: Forex
The U.S. dollar slipped lower in early European trade Friday, adding to the previous session’s sharp losses after the U.S. Congress approved the debt ceiling bill, while traders awaited the widely watched monthly payrolls release.
Today, the U.S. dollar index measures the Greenback against a trade-weighted basket of six major currencies, which slipped 0.11% to 103.380.
The Euro US Dollar (EUR/USD) is a widely traded pair that is up 0.05% today. This left the pair trading around $1.07680.
The Japanese yen was negative against the U.S. dollar on Friday. Today USD/JPY is surged 0.06% to the 138.880 level.
Another commodity-related currency positive against the U.S dollar, AUD/USD rose 0.87% to 0.66280, and NZD/USD surged 0.51% to 0.61020 level.
EUR/USD Intraday: Support level at 1.07630
Our pivot point is at 1.07630
Preferable Price Action: Take buy positions above pivot level with targets at 1.08000 & 1.08250 in extension.
Alternative Price Action: Below pivot looks for a further downside to 1.07280 & 1.07020.
Comment: RSI is above 50 levels and Pairs above its 20MA & 55MA.
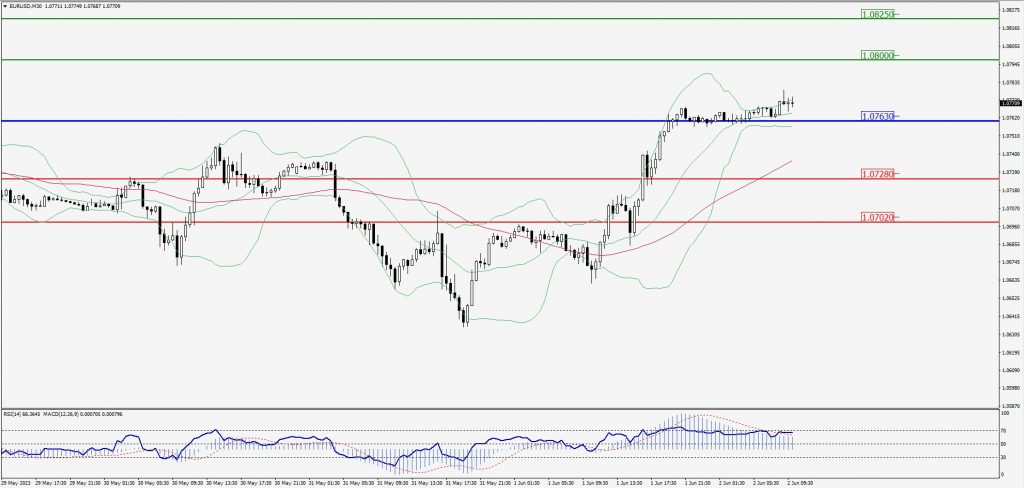
Green Lines Indicate Resistance Levels – Red Lines Indicate Support Levels
Light Blue is a Pivot Point – Black represents the price when the report was produced
GBP/USD Intraday: Trend on the upside
Our pivot point is at 1.25260
Preferable Price Action: Buy positions above pivot with targets at 1.25660 & 1.25940 in extension.
Alternative Price Action: The price below pivot would call for further downside to 1.24890 & 1.24640.
Comment: RSI is above 50 levels and Pairs above 55MA.
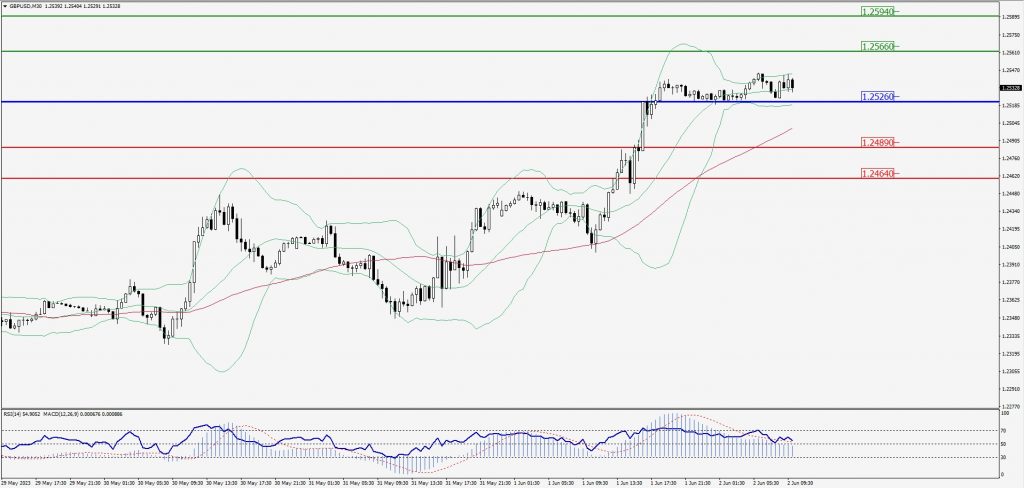
Green Lines Indicate Resistance Levels – Red Lines Indicate Support Levels
Light Blue is a Pivot Point – Black represents the price when the report was produced
USD/JPY Intraday: In a consolidation zone
Our pivot point is at 139.060
Preferable Price Action: Sell position below pivot with the target at 138.550 and 138.190 in extension.
Alternative Price Action: The upside breakout of the pivot would call for 139.520 and 139.870.
Comment: MACD is at 50 level and Pairs below 55MA.
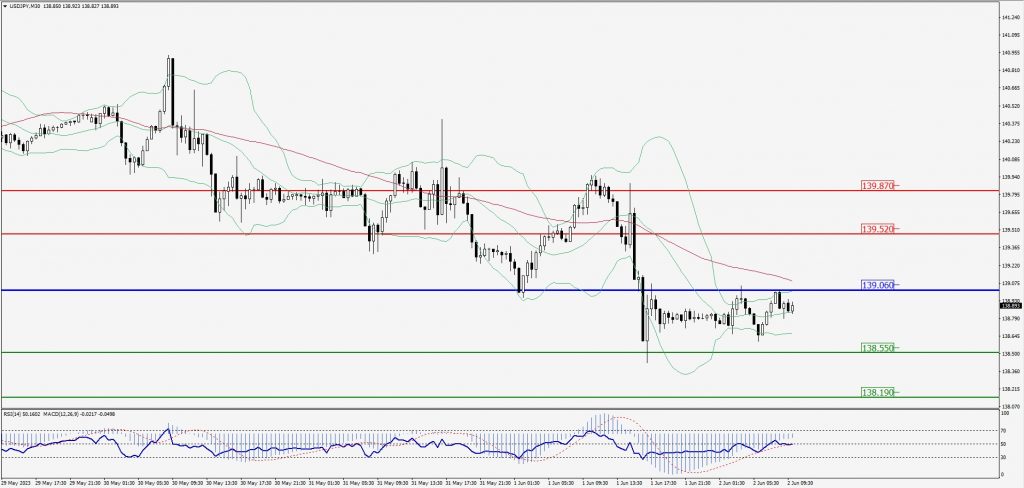
Green Lines Indicate Resistance Levels – Red Lines Indicate Support Levels
Light Blue is a Pivot Point – Black represents the price when the report was produced
AUD/USD Intraday: Major trend on the upside
Our pivot point is at 0.66100
Preferable Price Action: Buy positions above pivot with targets at 0.66530 & 0.66840 in extension.
Alternative Price Action: Below pivot looks for a further downside with 0.65700 & 0.65410 as targets.
Comment: RSI is above 50 levels and Pairs above its 20MA & 55MA.
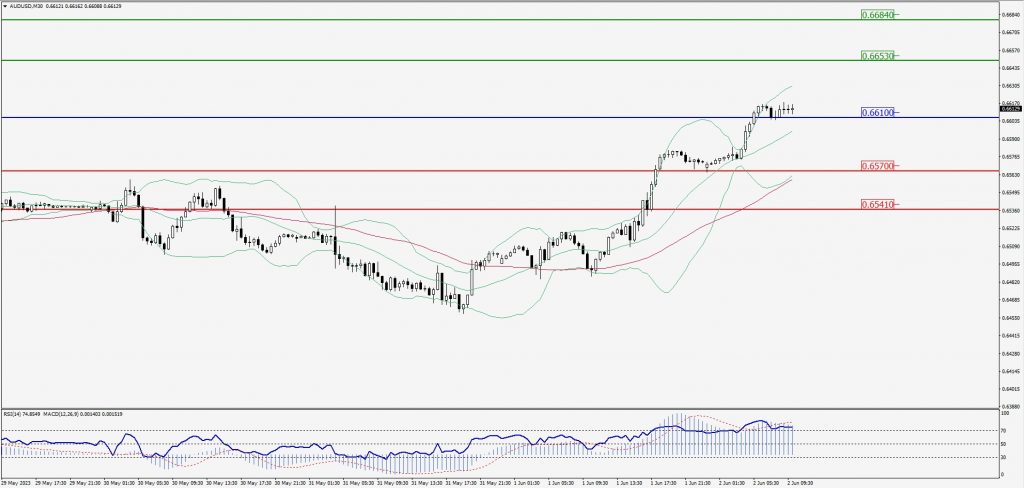
Green Lines Indicate Resistance Levels – Red Lines Indicate Support Levels
Light Blue is a Pivot Point – Black represents the price when the report was produced
CRUDEOIL Intraday: Trend on the upside
Our pivot point is at 70.59
Preferable Price Action: Above pivot buy oil with 72.45 & 73.77 as targets.
Alternative Price Action: Sell crude below pivot with targets at 68.82 and 67.57 in extension.
Comment: MACD is positive territory and Pairs above its 20MA & 55MA.
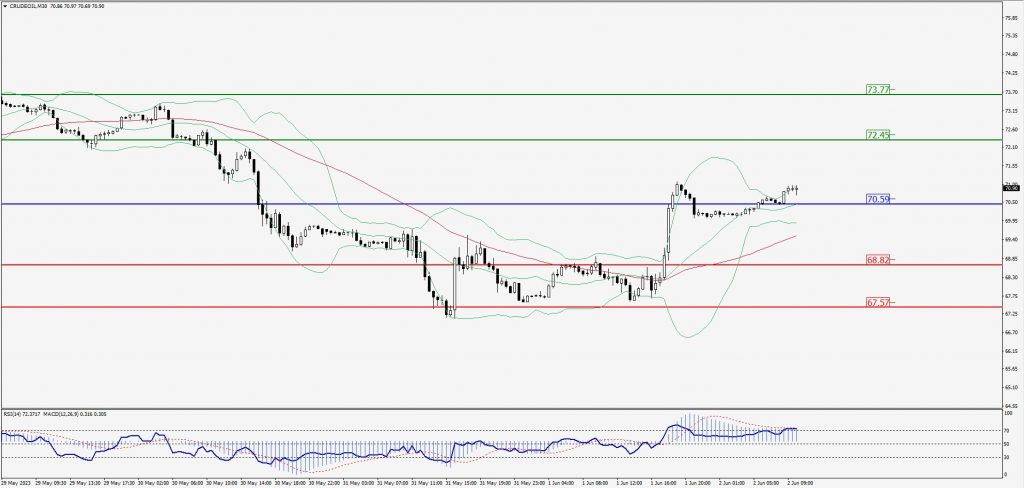
Green Lines Indicate Resistance Levels – Red Lines Indicate Support Levels
Light Blue is a Pivot Point – Black represents the price when the report was produced
XAU/USD Intraday: In a consolidation zone
Our pivot point is 1975.50
Preferable Price Action: Further upside to 1985.90 and 1993.50
Alternative Price Action: If the price gives a downside breakout of a pivot, then the price extends to 1966.00 and 1958.90.
Comment: MACD is at 50 level and Pairs above 55MA.
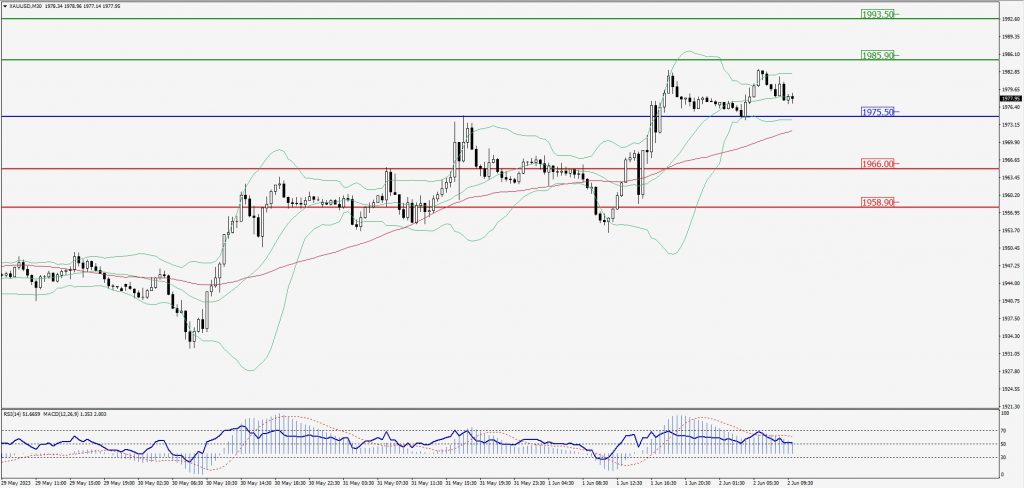
Green Lines Indicate Resistance Levels – Red Lines Indicate Support Levels
Light Blue is a Pivot Point – Black represents the price when the report was produced
Dow Jones Intraday: Trend on the upside
Our pivot point is 33,130.00
Preferable Price Action: Take buy positions above the pivot with targets at 33,217.00 & 33,290.00.
Alternative Price Action: Below 33,130.00 looks for further downside to 33,042.00 & 32,975.00.
Comment: RSI is above 50 levels and Pairs above its 20MA & 55MA.
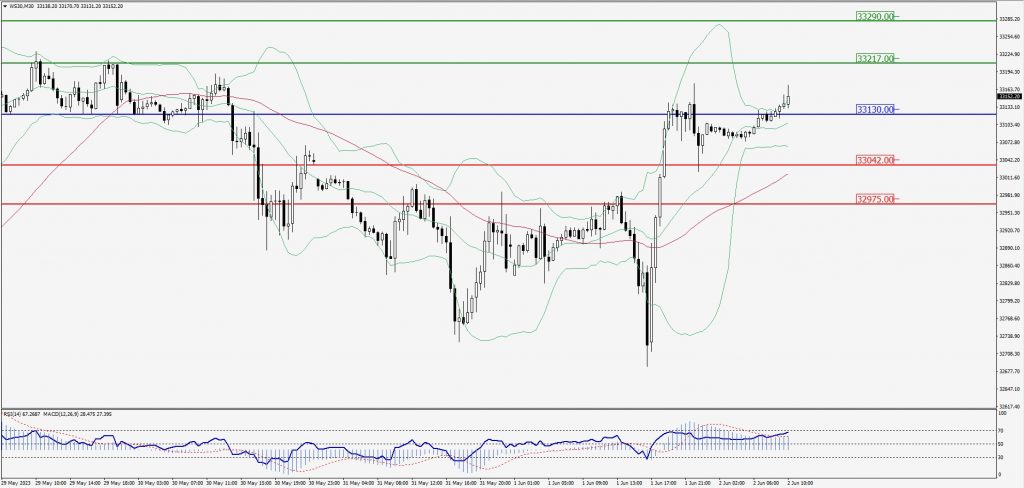
Green Lines Indicate Resistance Levels – Red Lines Indicate Support Levels
Light Blue is a Pivot Point – Black represents the price when the report was produced