Market Wrap: Stocks, Bonds, Commodities
Stock futures inched lower late Wednesday after the market wrapped the month of May, marked by a dramatic rally in artificial intelligence-related stocks.
The Dow Jones Industrial Average fell 134.51 points to 32,908.27, the S&P 500 lose 0.61% to 4,179.83 and the Nasdaq Composite subtract 82.14 points to 12,935.29.
MSCI’s index of Asia-Pacific stocks outside Japan is decline 0.08% to 616.75 levels. The Australian index was higher by 0.27% to 7,110.80. Japanese Nikkei Index advance 0.84% today.
European stocks were positive on Thursday, with the Stoxx Europe 50 Index rose 0.98% to 4,259.35, Germany’s DAX advance 1.12% to 15,838.15, and France’s CAC ascend 0.76% to 7,152.34 and U.K.’s FTSE 100 add 0.43% to 7,478.40.
Benchmark 10-year U.S. Treasury fell as demand for safe assets ascend again, today 10-year bond yields positive 1.05% to 3.6750.
Oil prices fell on Wednesday on a stronger U.S. dollar and as weak data from top oil importer China raised demand fears.
Spot Brent crude oil drop 0.06% to $72.57 per barrel. US West Texas Intermediate crude is down 0.09% to $68.03 a barrel.
The yellow metal gold is decline 0.29% to 1,976.45 dollars per ounce.
Market Wrap: Forex
The dollar rose on Thursday after a vote of approval from the U.S. House to suspend the debt ceiling, though the greenback drifted from a two-month high as investors trimmed bets the Federal Reserve will raise interest rates this month.
Today, the U.S. dollar index measures the Greenback against a trade-weighted basket of six major currencies, which slipped 0.12% to 104.120.
The Euro US Dollar (EUR/USD) is a widely traded pair that is up 0.13% today. This left the pair trading around $1.07040.
The Japanese yen was negative against the U.S. dollar on Thursday. Today USD/JPY is surged 0.32% to the 139.780 level.
Another commodity-related currency mixed against the U.S dollar, AUD/USD rose 0.12% to 0.65120, and NZD/USD slipped 0.15% to 0.60130 level.
EUR/USD Intraday: Resistance level at 1.06930
Our pivot point is at 1.06930
Preferable Price Action: Take sell positions below pivot level with targets at 1.06630 & 1.06420 in extension.
Alternative Price Action: Above pivot looks for a further upside to 1.07220 & 1.07460.
Comment: RSI is below 50 levels and Pairs below 20MA.
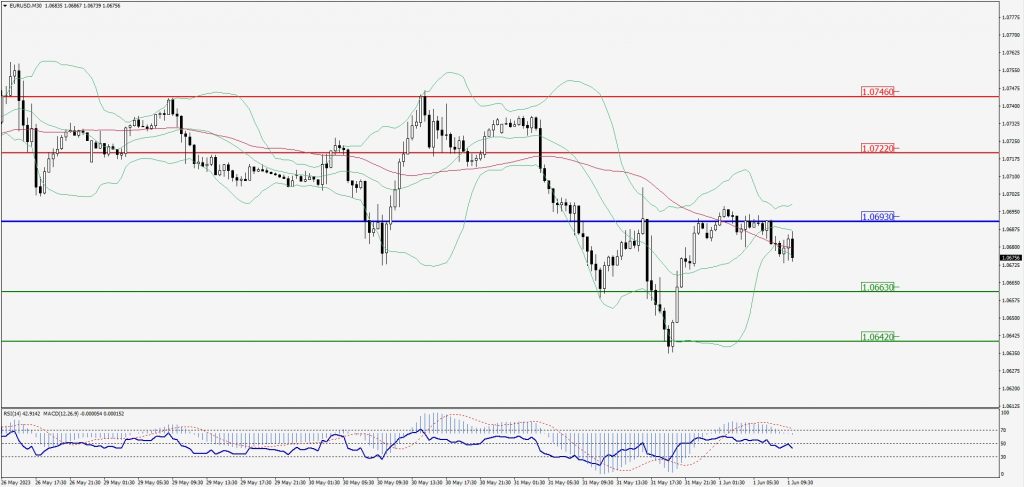
Green Lines Indicate Resistance Levels – Red Lines Indicate Support Levels
Light Blue is a Pivot Point – Black represents the price when the report was produced
GBP/USD Intraday: In a consolidation zone
Our pivot point is at 1.24250
Preferable Price Action: Buy positions above pivot with targets at 1.24580 & 1.24840 in extension.
Alternative Price Action: The price below pivot would call for further downside to 1.23900 & 1.23690.
Comment: RSI is at 50 levels and Pairs above 55MA.
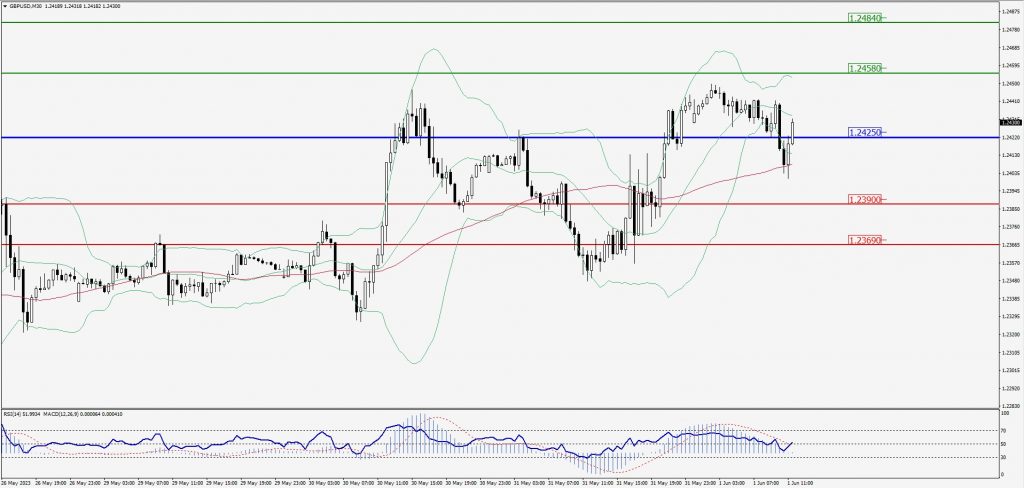
Green Lines Indicate Resistance Levels – Red Lines Indicate Support Levels
Light Blue is a Pivot Point – Black represents the price when the report was produced
USD/JPY Intraday: Trend on the upside
Our pivot point is at 139.690
Preferable Price Action: Buy position above pivot with the target at 140.180 and 140.500 in extension.
Alternative Price Action: The downside breakout of the pivot would call for 139.240 and 138.960.
Comment: MACD is above 50 level and Pairs above its 20MA & 55MA.
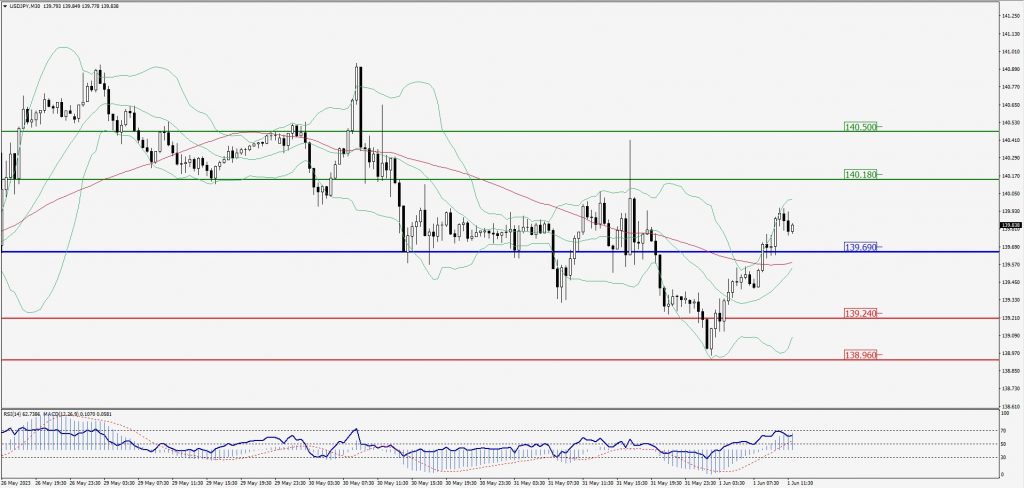
Green Lines Indicate Resistance Levels – Red Lines Indicate Support Levels
Light Blue is a Pivot Point – Black represents the price when the report was produced
AUD/USD Intraday: Support level at 0.64980
Our pivot point is at 0.64980
Preferable Price Action: Buy positions above pivot with targets at 0.65220 & 0.65410 in extension.
Alternative Price Action: Below pivot looks for a further downside with 0.64770 & 0.64570 as targets.
Comment: RSI is above 50 levels and Pairs above 55MA.
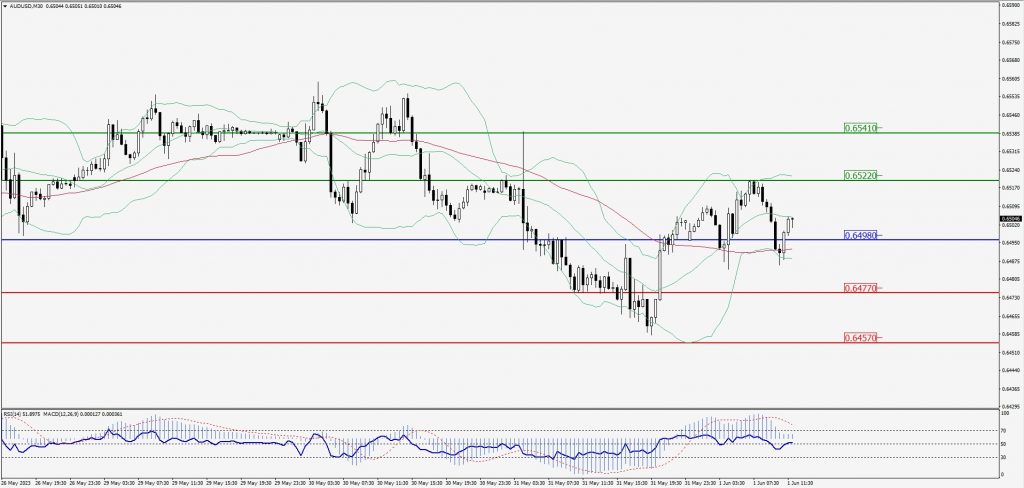
Green Lines Indicate Resistance Levels – Red Lines Indicate Support Levels
Light Blue is a Pivot Point – Black represents the price when the report was produced
CRUDEOIL Intraday: In a consolidation zone
Our pivot point is at 68.85
Preferable Price Action: Below pivot sell oil with 67.35 & 66.41 as targets.
Alternative Price Action: Buy crude above pivot with targets at 70.12 and 71.22 in extension.
Comment: MACD is negative territory and Pairs below 55MA.
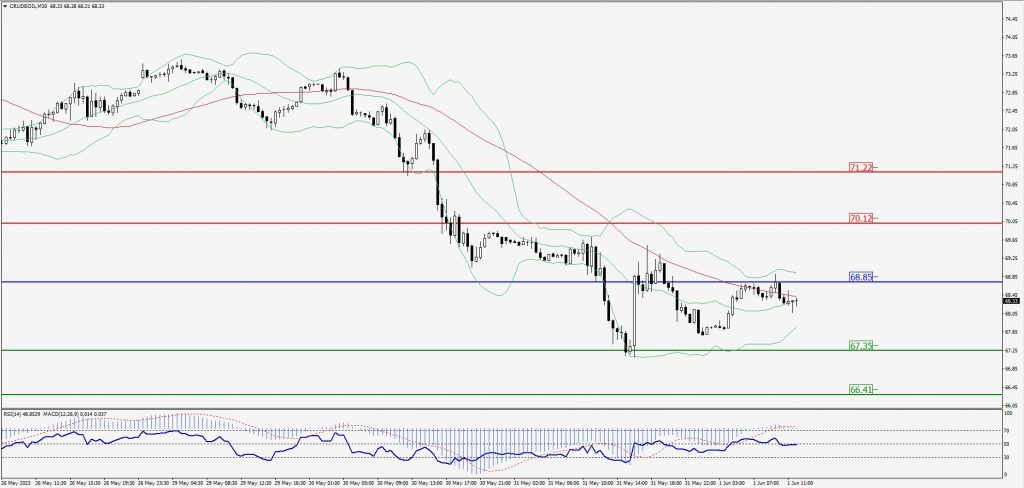
Green Lines Indicate Resistance Levels – Red Lines Indicate Support Levels
Light Blue is a Pivot Point – Black represents the price when the report was produced
XAU/USD Intraday: Trend on the downside
Our pivot point is 1960.40
Preferable Price Action: Further downside to 1951.30 and 1945.00
Alternative Price Action: If the price gives an upside breakout of a pivot, then the price extends to 1968.50 and 1974.70.
Comment: MACD is below 50 level and Pairs below its 20MA & 55MA.
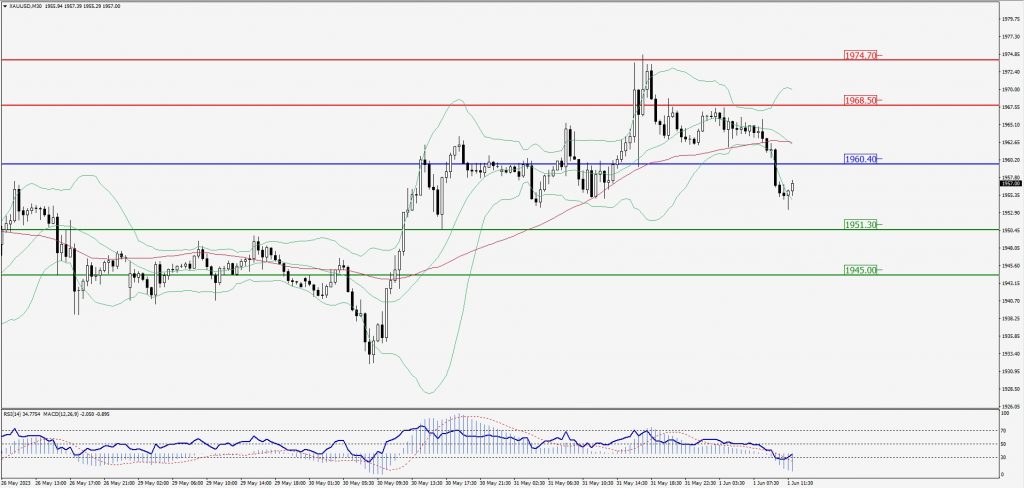
Green Lines Indicate Resistance Levels – Red Lines Indicate Support Levels
Light Blue is a Pivot Point – Black represents the price when the report was produced
Dow Jones Intraday: Major support level at 32,931.00
Our pivot point is 32,931.00
Preferable Price Action: Take buy positions above the pivot with targets at 33,060.00 & 33,154.00.
Alternative Price Action: Below 32,931.00 looks for further downside to 32,806.00 & 32,717.00.
Comment: RSI is above 50 levels and Pairs above its 20MA & 55MA.
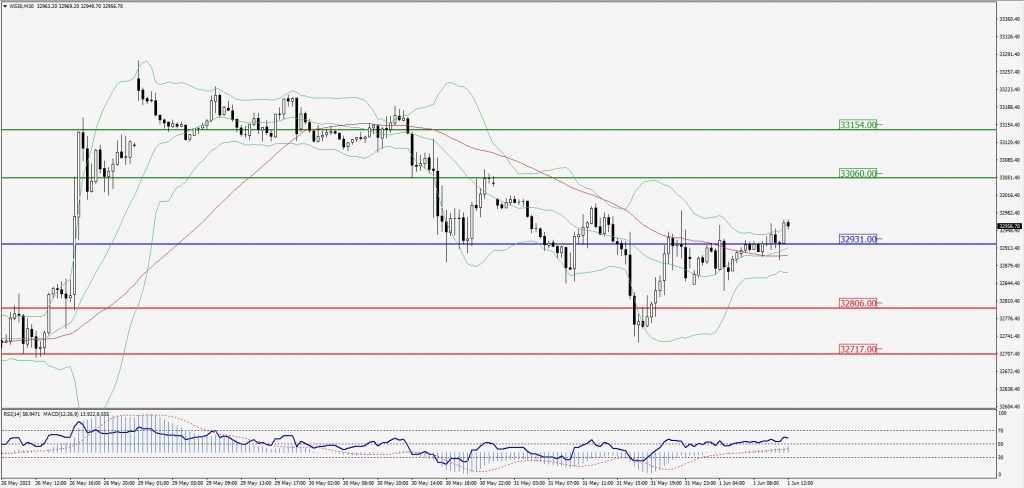
Green Lines Indicate Resistance Levels – Red Lines Indicate Support Levels
Light Blue is a Pivot Point – Black represents the price when the report was produced