Market Wrap: Stocks, Bonds, Commodities
The S&P 500 ended slightly higher on Monday as a deal for Silicon Valley Bank’s assets helped boost the bank shares, while a decline in technology-related stocks limited the day’s gains.
The Dow Jones Industrial Average rose 194.55 points to 32,432.08, the S&P 500 gain 0.16% to 3,977.53 and the Nasdaq Composite subtract 55.12 points to 11,768.84.
MSCI’s index of Asia-Pacific stocks outside Japan is advance 0.52% to 631.69 levels. The Australian index was higher by 1.04% to 7,034.10. Japanese Nikkei Index advance 0.15% today.
European stocks were positive on Tuesday, with the Stoxx Europe 50 Index rose 0.51% to 4,186.85, Germany’s DAX advance 0.49% to 15,201.65, and France’s CAC ascend 0.63% to 7,122.82, and U.K.’s FTSE 100 add 0.47% to 7,506.20.
Benchmark 10-year U.S. Treasury fell as demand for safe assets ascend again, today 10-year bond yields are positive 0.69% to 3.5530.
Crude prices moved in a narrow range in early Asian trade on Tuesday after rallying in the previous session, with oil markets focused on developments in the banking crisis as well as on supply concerns and indications of strengthening demand.
Spot Brent crude oil ascend 0.06% to $77.81 per barrel. US West Texas Intermediate crude is up 0.29% to $73.02 a barrel.
The yellow metal gold is advance 0.04% to 1,972.30 dollars per ounce.
Market Wrap: Forex
The U.S. dollar drifted lower in early European trade Tuesday as returning confidence in the global banking sector weakened demand for this safe haven.
Today, the U.S. dollar index measures the Greenback against a trade-weighted basket of six major currencies, which slipped 0.23% to 102.280.
The Euro US Dollar (EUR/USD) is a widely traded pair that is up 0.25% today. This left the pair trading around $1.08240.
The Japanese yen was negative against the U.S. dollar on Tuesday. Today USD/JPY is slipped 0.29% to the 131.18 level.
Another commodity-related currency positive against the U.S dollar, AUD/USD rose 0.48% to 0.66810, and NZD/USD surged 0.53% to 0.62280 level.
EUR/USD Intraday: Trend on the upside
Our pivot point is at 1.08110
Preferable Price Action: Take buy positions above pivot level with targets at 1.08480 & 1.08720 in extension.
Alternative Price Action: Below pivot looks for a further downside to 1.07790 & 1.07570.
Comment: RSI is above 50 levels and Pairs above 55MA.
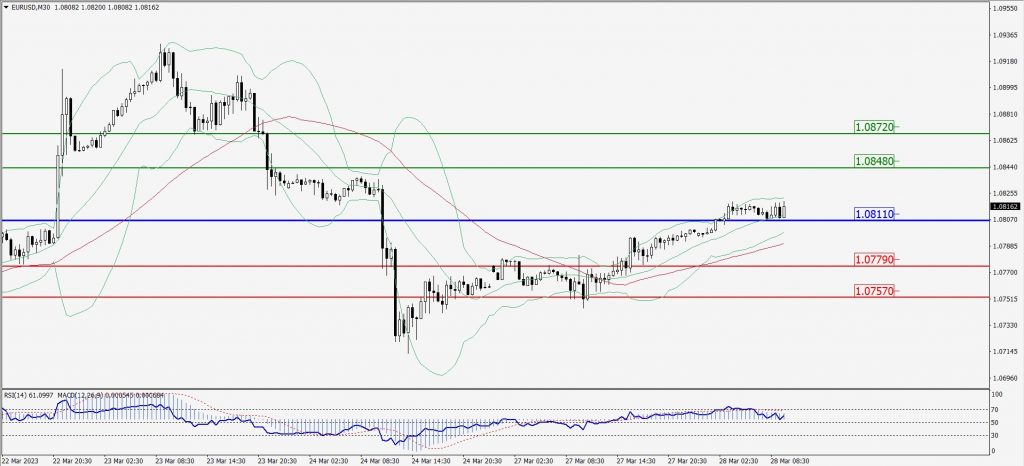
Green Lines Indicate Resistance Levels – Red Lines Indicate Support Levels
Light Blue is a Pivot Point – Black represents the price when the report was produced
GBP/USD Intraday: Major trend on the upside
Our pivot point is at 1.23140
Preferable Price Action: Buy positions above pivot with targets at 1.23520 & 1.23790 in extension.
Alternative Price Action: The price below pivot would call for further downside to 1.22820 & 1.22580.
Comment: RSI is above 50 levels and Pairs above its 20MA & 55MA.
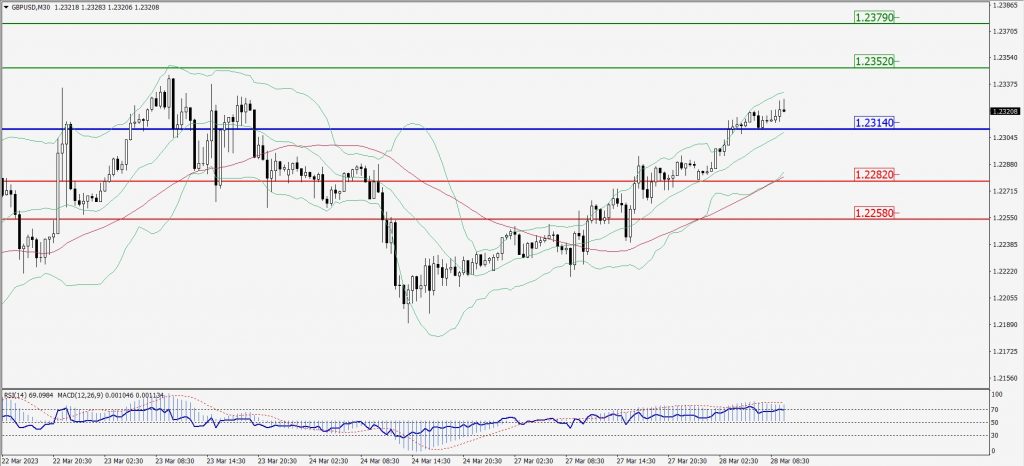
Green Lines Indicate Resistance Levels – Red Lines Indicate Support Levels
Light Blue is a Pivot Point – Black represents the price when the report was produced
USD/JPY Intraday: In a consolidation zone
Our pivot point is at 130.790
Preferable Price Action: Buy position above pivot with the target at 131.350 and 131.740 in extension.
Alternative Price Action: The downside breakout of the pivot would call for 130.290 and 129.950.
Comment: MACD is at 50 level and Pairs above 20MA.
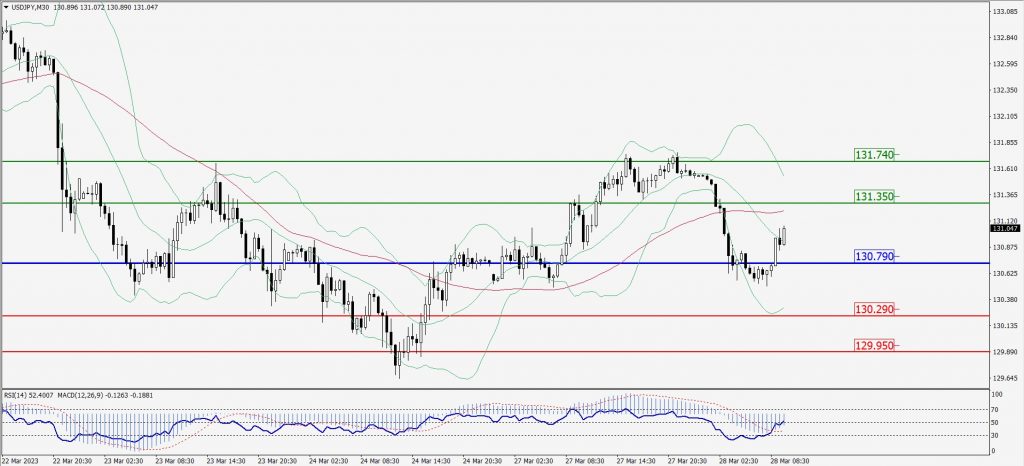
Green Lines Indicate Resistance Levels – Red Lines Indicate Support Levels
Light Blue is a Pivot Point – Black represents the price when the report was produced
AUD/USD Intraday: Trend on the upside
Our pivot point is at 0.66770
Preferable Price Action: Buy positions above pivot with targets at 0.66990 & 0.67150 in extension.
Alternative Price Action: Below pivot looks for a further downside with 0.66590 & 0.66460 as targets.
Comment: RSI is above 50 levels and Pairs above its 20MA & 55MA.
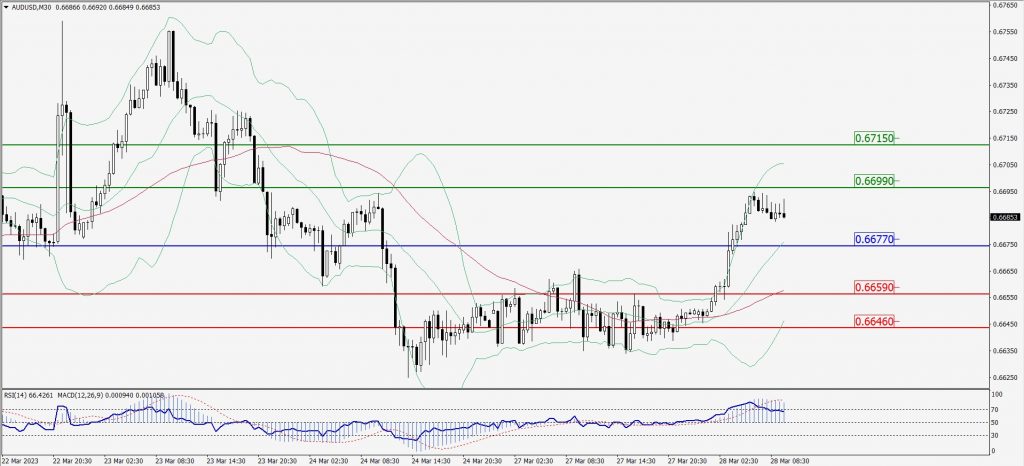
Green Lines Indicate Resistance Levels – Red Lines Indicate Support Levels
Light Blue is a Pivot Point – Black represents the price when the report was produced
CRUDEOIL Intraday: Trend on the upside
Our pivot point is at 72.52
Preferable Price Action: Above pivot buy oil with 73.90 & 74.92 as targets.
Alternative Price Action: Sell crude below pivot with targets at 71.22 and 70.28 in extension.
Comment: MACD is positive territory and Pairs above 55MA.
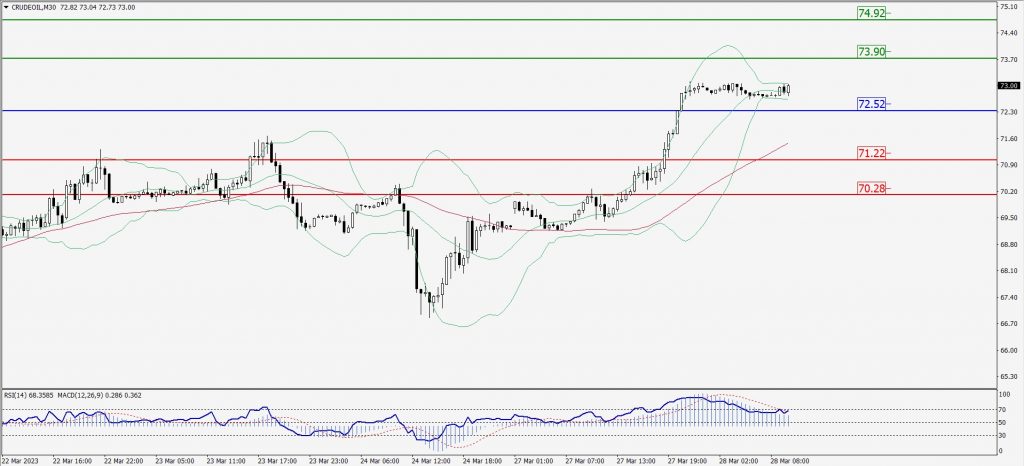
Green Lines Indicate Resistance Levels – Red Lines Indicate Support Levels
Light Blue is a Pivot Point – Black represents the price when the report was produced
XAU/USD Intraday: Trend on the downside
Our pivot point is 1963.90
Preferable Price Action: Further downside to 1949.80 and 1941.50
Alternative Price Action: If the price gives an upside breakout of a pivot, then the price extends to 1977.30 and 1987.30.
Comment: MACD is below 50 level and Pairs below its 20MA & 55MA.
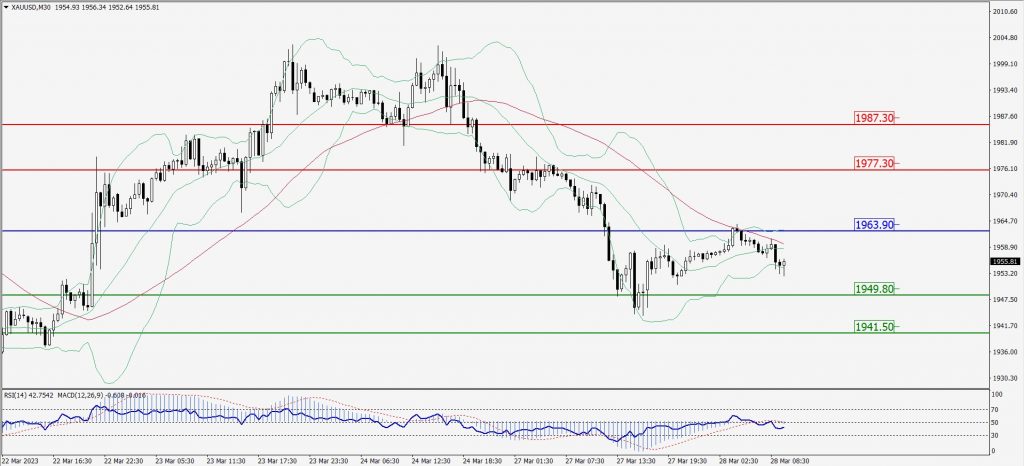
Green Lines Indicate Resistance Levels – Red Lines Indicate Support Levels
Light Blue is a Pivot Point – Black represents the price when the report was produced
Dow Jones Intraday: Support level at 32,512.00
Our pivot point is 32,512.00
Preferable Price Action: Take buy positions above the pivot with targets at 32,697.00 & 32,832.00.
Alternative Price Action: Below 32,512.00 looks for further downside to 32,346.00 & 32,218.00.
Comment: RSI is above 50 levels and Pairs above its 20MA & 55MA.
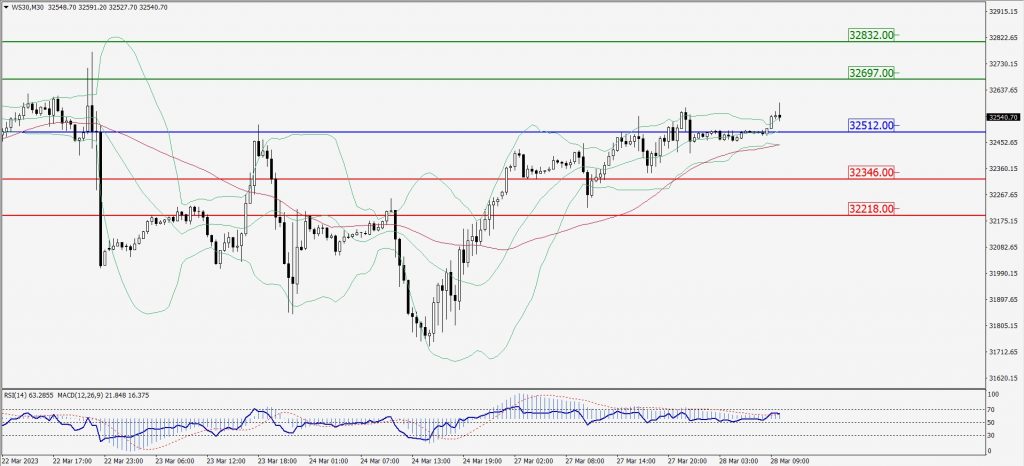
Green Lines Indicate Resistance Levels – Red Lines Indicate Support Levels
Light Blue is a Pivot Point – Black represents the price when the report was produced