Market Wrap: Stocks, Bonds, Commodities
US stocks closed higher on Friday, marking the end of a tumultuous week as Federal Reserve officials calmed investor fears over a potential liquidity crisis in the banking sector.
The Dow Jones Industrial Average rose 132.28 points to 32,237.53, the S&P 500 gain 0.56% to 3,970.99 and the Nasdaq Composite add 36.55 points to 11,823.96.
MSCI’s index of Asia-Pacific stocks outside Japan is decline 0.99% to 628.79 levels. The Australian index was higher by 0.10% to 6,962.00. Japanese Nikkei Index advance 0.33% today.
European stocks were positive on Monday, with the Stoxx Europe 50 Index rose 1.06% to 4,174.45, Germany’s DAX advance 1.35% to 15,159.15, and France’s CAC ascend 1.17% to 7,097.02, and U.K.’s FTSE 100 add 0.91% to 7,472.90.
Benchmark 10-year U.S. Treasury fell as demand for safe assets ascend again, today 10-year bond yields are positive 2.38% to 3.4580.
Oil prices climbed in early trade on Monday as concerns over turmoil in the banking sector eased, while comments by Russian President Vladimir Putin over the weekend ratcheted up geopolitical tensions in Europe.
Spot Brent crude oil ascend 1.07% to $75.39 per barrel. US West Texas Intermediate crude is up 1.11% to $70.03 a barrel.
The yellow metal gold is decline 1.63% to 1,969.30 dollars per ounce.
Market Wrap: Forex
The dollar was steady on Monday, while the yen hovered near its seven-week peak as investors assessed moves made by authorities and regulators to rein in worries over the global banking system.
Today, the U.S. dollar index measures the Greenback against a trade-weighted basket of six major currencies, which surged 0.02% to 102.780.
The Euro US Dollar (EUR/USD) is a widely traded pair that is down 0.05% today. This left the pair trading around $1.07640.
The Japanese yen was negative against the U.S. dollar on Monday. Today USD/JPY is surged 0.60% to the 131.48 level.
Another commodity-related currency mixed against the U.S dollar, AUD/USD rose 0.02% to 0.66460, and NZD/USD slipped 0.19% to 0.61890 level.
EUR/USD Intraday: Support level at 1.07620
Our pivot point is at 1.07620
Preferable Price Action: Take buy positions above pivot level with targets at 1.07950 & 1.08230 in extension.
Alternative Price Action: Below pivot looks for a further downside to 1.07250 & 1.07000.
Comment: RSI is at 50 levels.
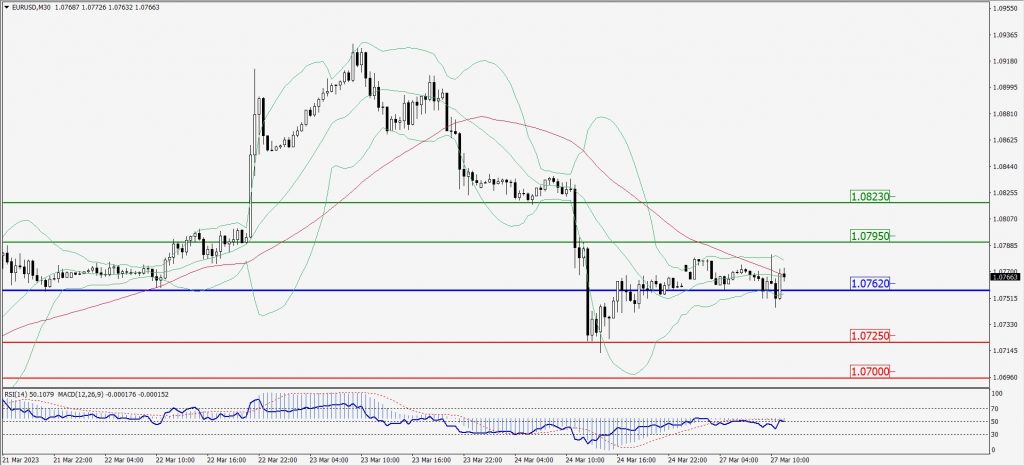
Green Lines Indicate Resistance Levels – Red Lines Indicate Support Levels
Light Blue is a Pivot Point – Black represents the price when the report was produced
GBP/USD Intraday: Trend on the upside
Our pivot point is at 1.22510
Preferable Price Action: Buy positions above pivot with targets at 1.22760 & 1.22940 in extension.
Alternative Price Action: The price below pivot would call for further downside to 1.22290 & 1.22120.
Comment: RSI is above 50 levels and Pairs above its 20MA & 55MA.
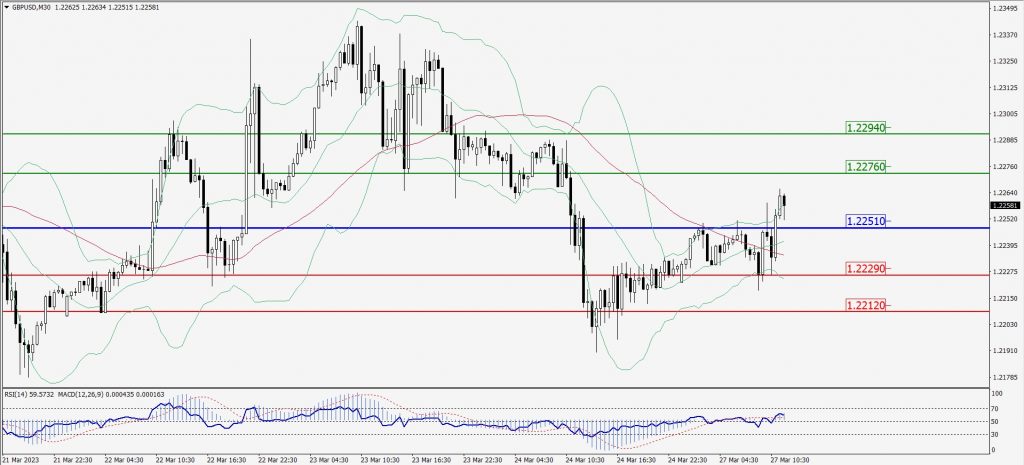
Green Lines Indicate Resistance Levels – Red Lines Indicate Support Levels
Light Blue is a Pivot Point – Black represents the price when the report was produced
USD/JPY Intraday: Trend on the upside
Our pivot point is at 131.040
Preferable Price Action: Buy position above pivot with the target at 131.600 and 131.990 in extension.
Alternative Price Action: The downside breakout of the pivot would call for 130.550 and 130.210.
Comment: MACD is above 50 level and Pairs above its 20MA & 55MA.
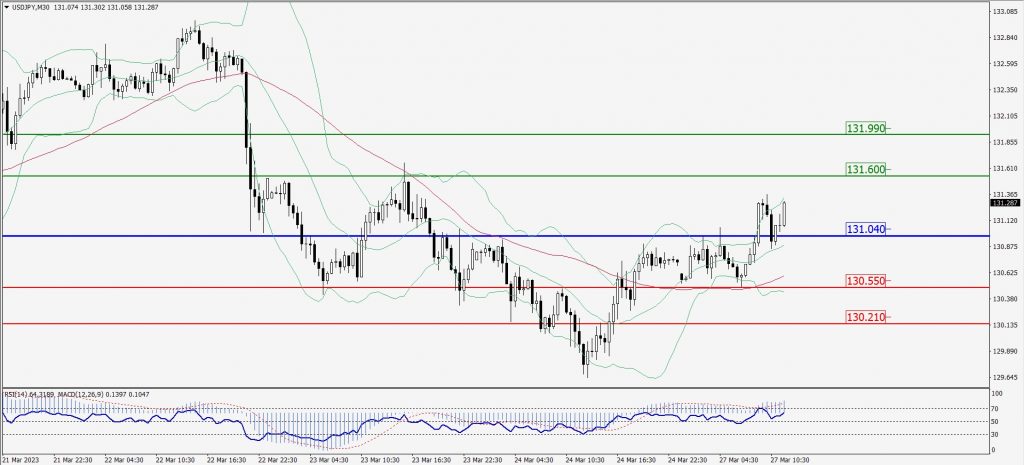
Green Lines Indicate Resistance Levels – Red Lines Indicate Support Levels
Light Blue is a Pivot Point – Black represents the price when the report was produced
AUD/USD Intraday: Resistance level at 0.66620
Our pivot point is at 0.66620
Preferable Price Action: Sell positions below pivot with targets at 0.66270 & 0.66040 in extension.
Alternative Price Action: Above pivot looks for a further upside with 0.66900 & 0.67140 as targets.
Comment: RSI is below 50 levels.
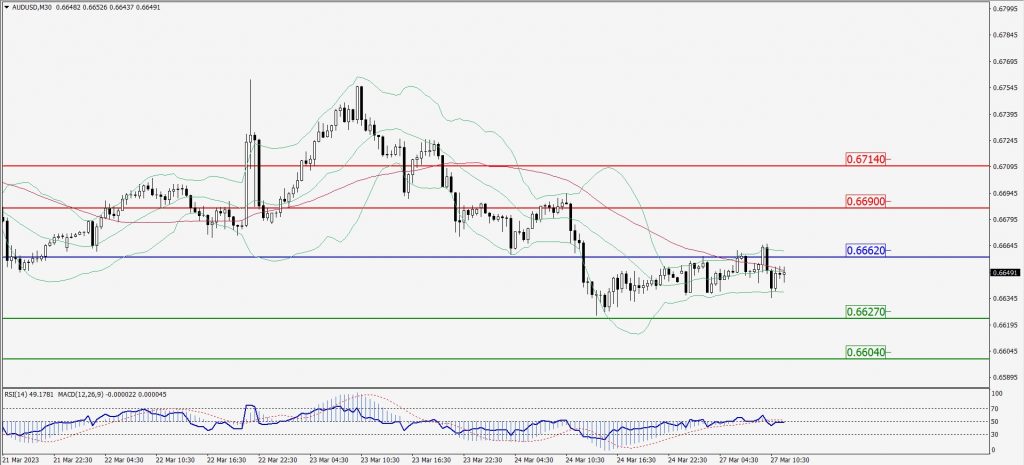
Green Lines Indicate Resistance Levels – Red Lines Indicate Support Levels
Light Blue is a Pivot Point – Black represents the price when the report was produced
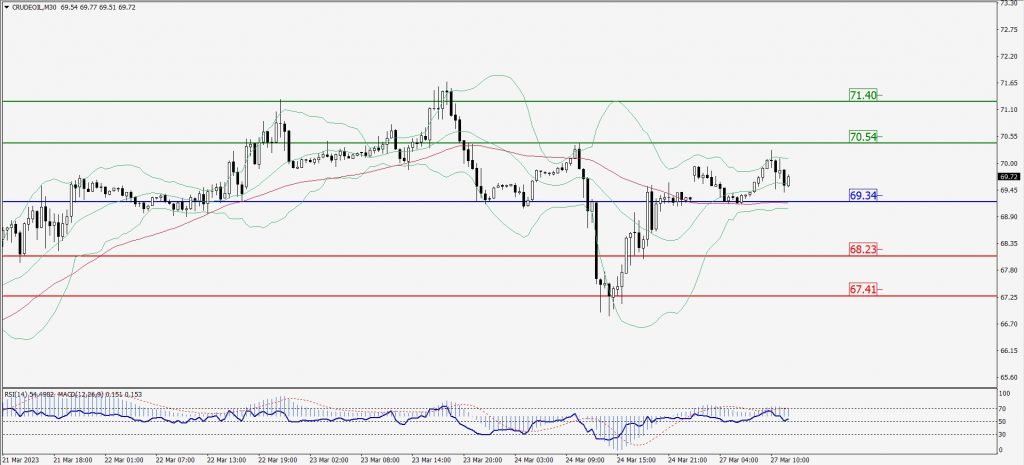
CRUDEOIL Intraday: Trend on the upside
Our pivot point is at 69.34
Preferable Price Action: Above pivot buy oil with 70.54 & 71.40 as targets.
Alternative Price Action: Sell crude below pivot with targets at 68.23 and 67.41 in extension.
Comment: MACD is positive territory and Pairs above its 20MA & 55MA.
Green Lines Indicate Resistance Levels – Red Lines Indicate Support Levels
Light Blue is a Pivot Point – Black represents the price when the report was produced
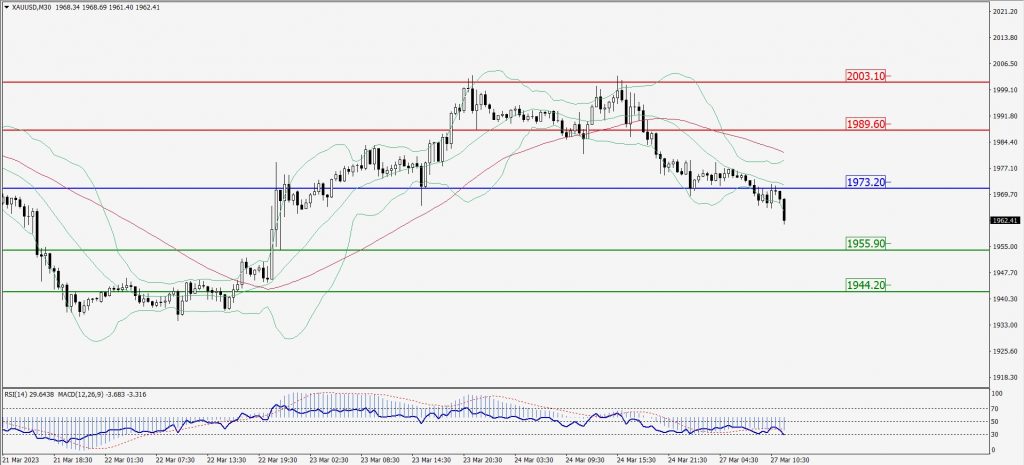
XAU/USD Intraday: Trend on the downside
Our pivot point is 1973.20
Preferable Price Action: Further downside to 1955.90 and 1944.20
Alternative Price Action: If the price gives an upside breakout of a pivot, then the price extends to 1989.60 and 2003.10.
Comment: MACD is below 50 level and Pairs below its 20MA & 55MA.
Green Lines Indicate Resistance Levels – Red Lines Indicate Support Levels
Light Blue is a Pivot Point – Black represents the price when the report was produced
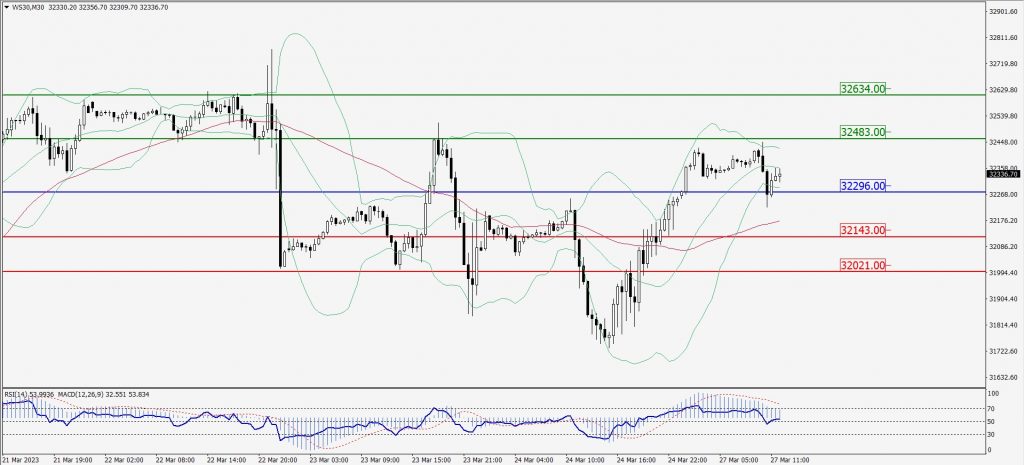
Dow Jones Intraday: Trend on the upside
Our pivot point is 32,296.00
Preferable Price Action: Take buy positions above the pivot with targets at 32,483.00 & 32,634.00.
Alternative Price Action: Below 32,296.00 looks for further downside to 32,143.00 & 32,021.00.
Comment: RSI is above 50 levels and Pairs above 55MA.
Green Lines Indicate Resistance Levels – Red Lines Indicate Support Levels
Light Blue is a Pivot Point – Black represents the price when the report was produced