Market Wrap: Stocks, Bonds, Commodities
Sliding bank shares dragged Wall Street down on Monday with investors worried about contagion from the Silicon Valley Bank collapse, but trade was choppy and the Nasdaq composite actually ended higher as some sectors benefited from hopes the Federal Reserve could ease up on interest rates hikes.
The Dow Jones Industrial Average fell 90.50 points to 31,819.14, the S&P 500 lose 0.15% to 3,855.76 and the Nasdaq Composite add 49.96 points to 11,188.84
MSCI’s index of Asia-Pacific stocks outside Japan is decline 1.76% to 612.96 levels. The Australian index was lower by 1.41% to 7,008.90. Japanese Nikkei Index fell 2.19% today.
European stocks were mixed on Tuesday, with the Stoxx Europe 50 Index rose 0.03% to 4,098.65, Germany’s DAX advance 0.14% to 14,986.05, and France’s CAC drop 0.02% to 7,009.90, and U.K.’s FTSE 100 subtract 0.45% to 7,515.72.
Benchmark 10-year U.S. Treasury fell as demand for safe assets ascend again, today 10-year bond yields are positive 1.01% to 3.5510.
Oil prices fell over 2 percent in volatile trading on Monday as the collapse of Silicon Valley Bank roiled equities markets and raised fears of a fresh financial crisis, but a recovery in Chinese demand provided support.
Spot Brent crude oil fell 1.28% to $79.74 per barrel. US West Texas Intermediate crude is down 1.44% to $73.72 a barrel.
The yellow metal gold is decline 0.15% to 1,913.20 dollars per ounce.
Market Wrap: Forex
The dollar languished near a multi-week low on Tuesday as fears of a broader systemic crisis following the collapse of a U.S. tech-focused lender left traders speculating that the Federal Reserve could pause its aggressive rate-hiking cycle.
Today, the U.S. dollar index measures the Greenback against a trade-weighted basket of six major currencies, which surged 0.31% to 103.500.
The Euro US Dollar (EUR/USD) is a widely traded pair that is down 0.30% today. This left the pair trading around $1.06950.
The Japanese yen was negative against the U.S. dollar on Tuesday. Today USD/JPY is surged 0.53% to the 133.880 level.
Another commodity-related currency positive against the U.S dollar, AUD/USD rose 0.03% to 0.66660, and NZD/USD rose 0.09% to 0.62240 level.
EUR/USD Intraday: Trend on the downside
Our pivot point is at 1.07130
Preferable Price Action: Take short positions below pivot level with targets at 1.06670 & 1.06380 in extension.
Alternative Price Action: Above pivot looks for a further upside to 1.07550 & 1.07860.
Comment: RSI is below 50 levels and Pairs below its 20MA & 55MA.
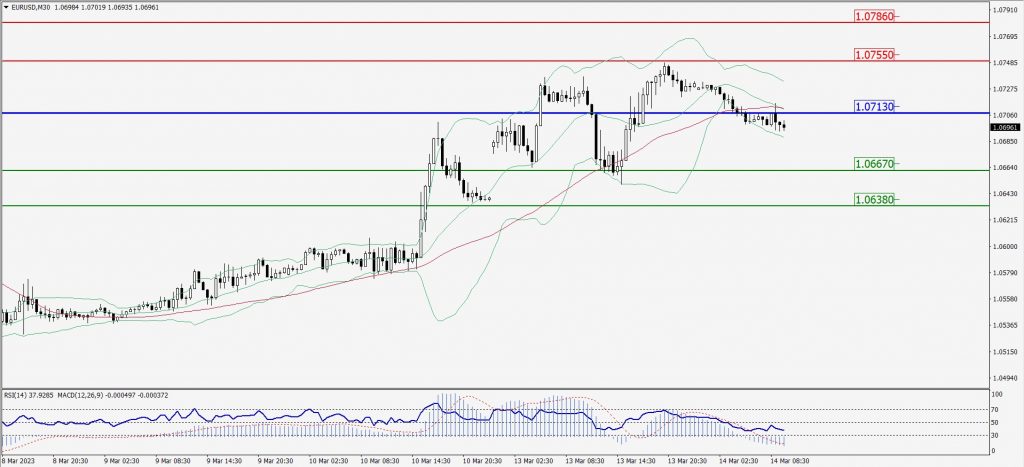
Green Lines Indicate Resistance Levels – Red Lines Indicate Support Levels
Light Blue is a Pivot Point – Black represents the price when the report was produced
GBP/USD Intraday: Support level at 1.21550
Our pivot point is at 1.21550
Preferable Price Action: Buy positions above pivot with targets at 1.22370 & 1.22890 in extension.
Alternative Price Action: The price below pivot would call for further downside to 1.20820 & 1.20280.
Comment: RSI is above 50 levels and Pairs above its 20MA & 55MA.
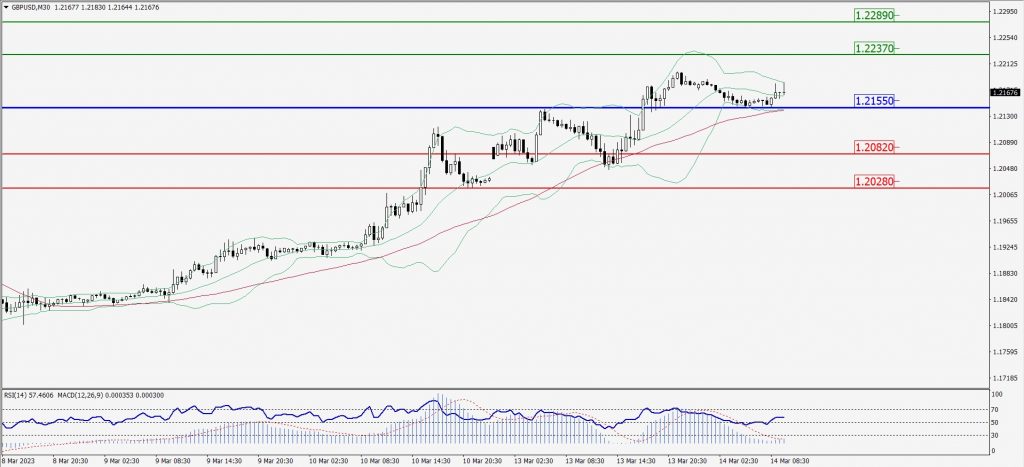
Green Lines Indicate Resistance Levels – Red Lines Indicate Support Levels
Light Blue is a Pivot Point – Black represents the price when the report was produced
USD/JPY Intraday: In a consolidation zone
Our pivot point is at 134.010
Preferable Price Action: Sell position below pivot with the target at 133.060 and 132.420 in extension.
Alternative Price Action: The upside breakout of the pivot would call for 134.830 and 135.460.
Comment: MACD is at 50 level.
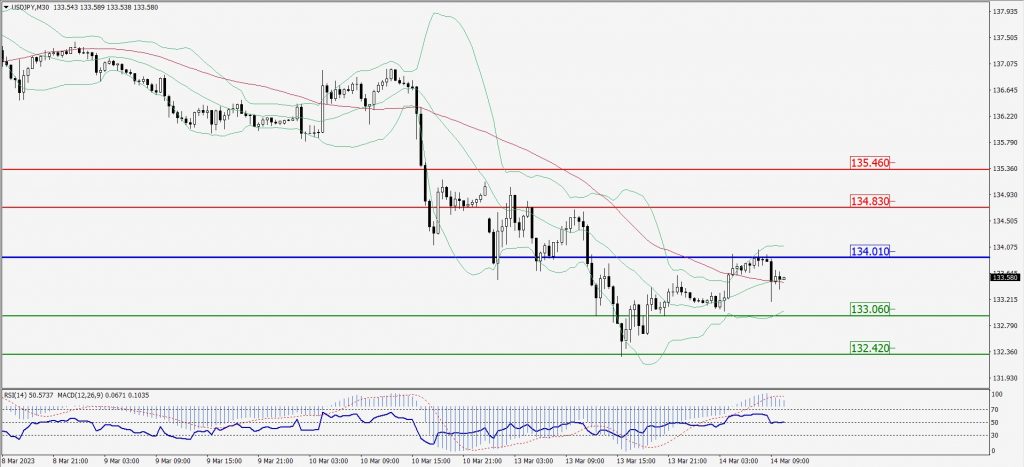
Green Lines Indicate Resistance Levels – Red Lines Indicate Support Levels
Light Blue is a Pivot Point – Black represents the price when the report was produced
AUD/USD Intraday: Trend on the upside
Our pivot point is at 0.66510
Preferable Price Action: Buy positions above pivot with targets at 0.66960 & 0.67310 in extension.
Alternative Price Action: Below pivot looks for a further downside with 0.66150 & 0.65860 as targets.
Comment: RSI is above 50 levels and pairs above 20MA.
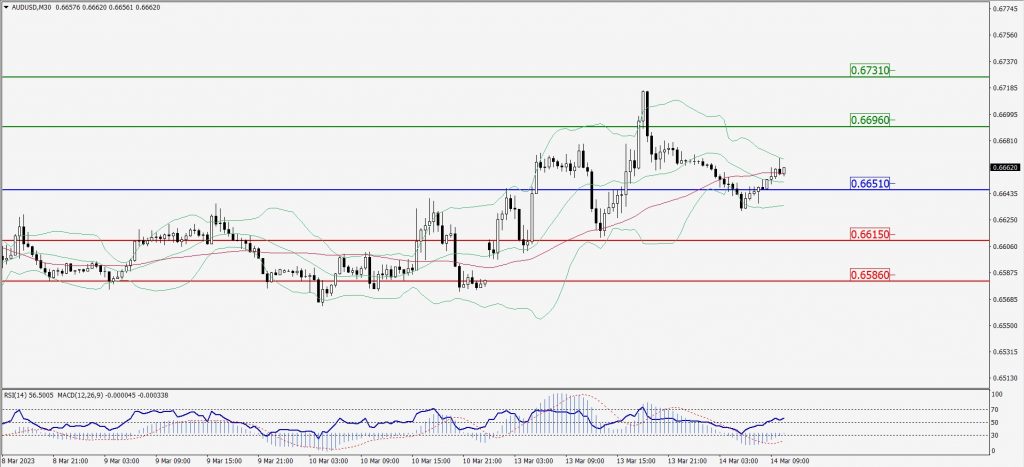
Green Lines Indicate Resistance Levels – Red Lines Indicate Support Levels
Light Blue is a Pivot Point – Black represents the price when the report was produced
CRUDEOIL Intraday: Trend on the downside
Our pivot point is at 74.56
Preferable Price Action: Below pivot sell oil with 73.51 & 72.82 as targets.
Alternative Price Action: Buy crude above pivot with targets at 75.46 and 76.24 in extension.
Comment: MACD is negative territory and Pairs below its 20MA & 55MA.
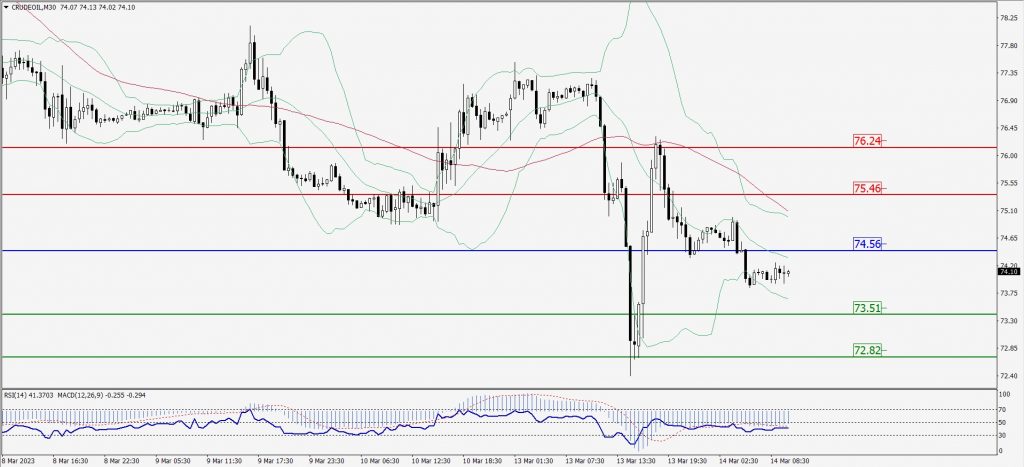
Green Lines Indicate Resistance Levels – Red Lines Indicate Support Levels
Light Blue is a Pivot Point – Black represents the price when the report was produced
XAU/USD Intraday: Trend on the upside
Our pivot point is 1904.00
Preferable Price Action: Further upside to 1932.80 and 1952.90
Alternative Price Action: If the price gives a downside breakout of a pivot, then the price extends to 1879.90 and 1861.40.
Comment: MACD is above 50 level and Pairs above its 20MA & 55MA.
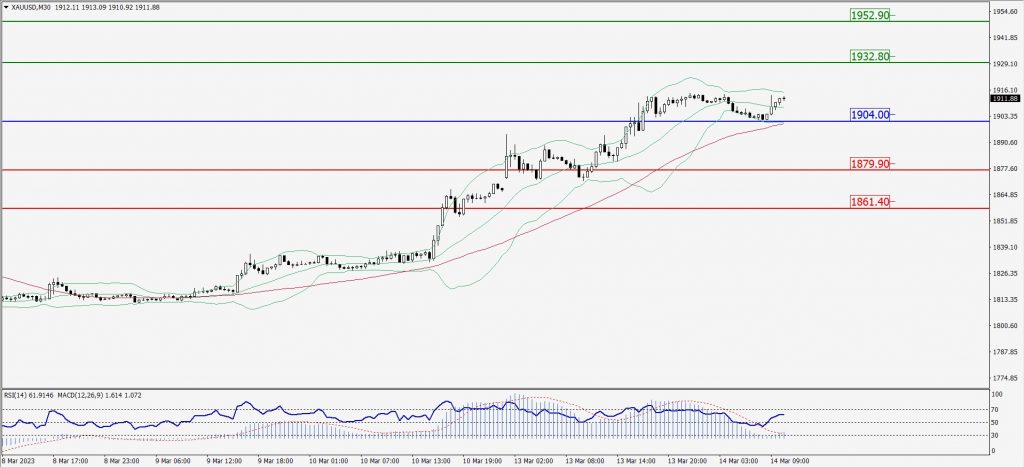
Green Lines Indicate Resistance Levels – Red Lines Indicate Support Levels
Light Blue is a Pivot Point – Black represents the price when the report was produced
Dow Jones Intraday: In a consolidation zone
Our pivot point is 32,054.00
Preferable Price Action: Take sell positions below the pivot with targets at 31,803.00 & 31,637.00.
Alternative Price Action: Above 32,054.00 looks for further upside to 32,273.00 & 32,449.00.
Comment: RSI is below 50 levels and Pairs below 55MA.
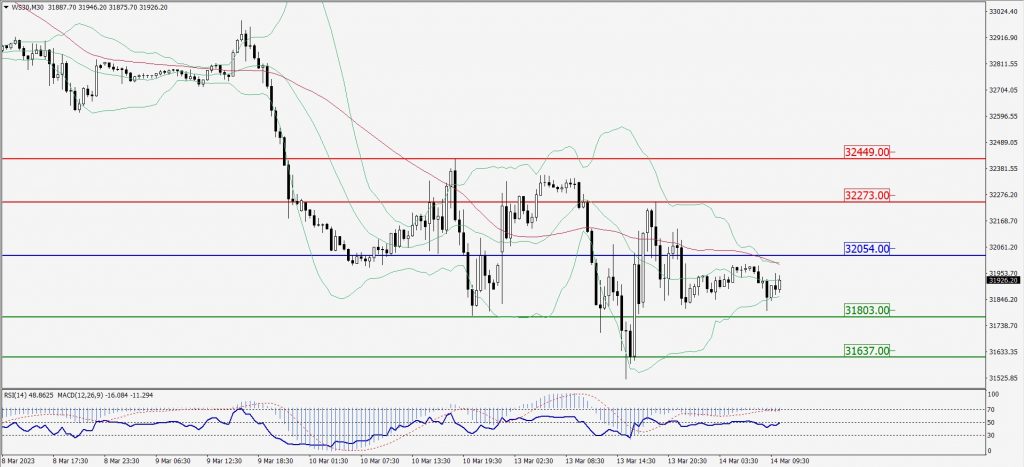
Green Lines Indicate Resistance Levels – Red Lines Indicate Support Levels
Light Blue is a Pivot Point – Black represents the price when the report was produced