Market Wrap: Stocks, Bonds, Commodities
Wall Street closed sharply higher on Monday as investors awaited inflation data likely to hint at the path of the Federal Reserve’s future interest rate hikes, while Meta Platforms gained after a report that the Facebook parent was planning fresh layoffs.
The Dow Jones Industrial Average rose 376.66 points to 34,245.93, the S&P 500 gain 1.14% to 4,137.29 and the Nasdaq Composite subtract 173.67 points to 11,891.79
MSCI’s index of Asia-Pacific stocks outside Japan is ascend 0.26% to 660.55 levels. The Australian index was higher by 0.18% to 7,430.90. Japanese Nikkei Index rose 0.64% today.
European stocks were positive on Tuesday, with the Stoxx Europe 50 Index gain 1.03% to 4,241.36, Germany’s DAX rose 0.58% to 15,397.34, and France’s CAC ascend 1.11% to 7,208.59, and U.K.’s FTSE 100 add 0.83% to 7,947.60.
Benchmark 10-year U.S. Treasury fell as demand for safe assets ascend again, today 10-year bond yields are negative 0.78% to 3.6900.
Oil prices edged higher on Monday, rebounding from early losses, as investors weighed Russia’s plans to cut crude production and short-term demand concerns ahead of US inflation data this week.
Spot Brent crude oil fell 0.45% to $86.22 per barrel. US West Texas Intermediate crude is down 0.84% to $79.47 a barrel.
The yellow metal gold is advance 0.37% to 1,870.45 dollars per ounce.
Market Wrap: Forex
The U.S. dollar retreated in early European trade Tuesday ahead of the latest readout of U.S. consumer inflation, while the yen gained upon the nomination of the next governor of the Bank of Japan.
Today, the U.S. dollar index measures the Greenback against a trade-weighted basket of six major currencies, which slipped 0.23% to 103.010.
The Euro US Dollar (EUR/USD) is a widely traded pair that is up 0.20% today. This left the pair trading around $1.07410.
The Japanese yen was negative against the U.S. dollar on Tuesday. Today USD/JPY is decline 0.38% to the 131.890 level.
Another commodity-related currency mix against the U.S dollar, AUD/USD gain 0.08% to 0.69700, and NZD/USD fell 0.07% to 0.63440 level.
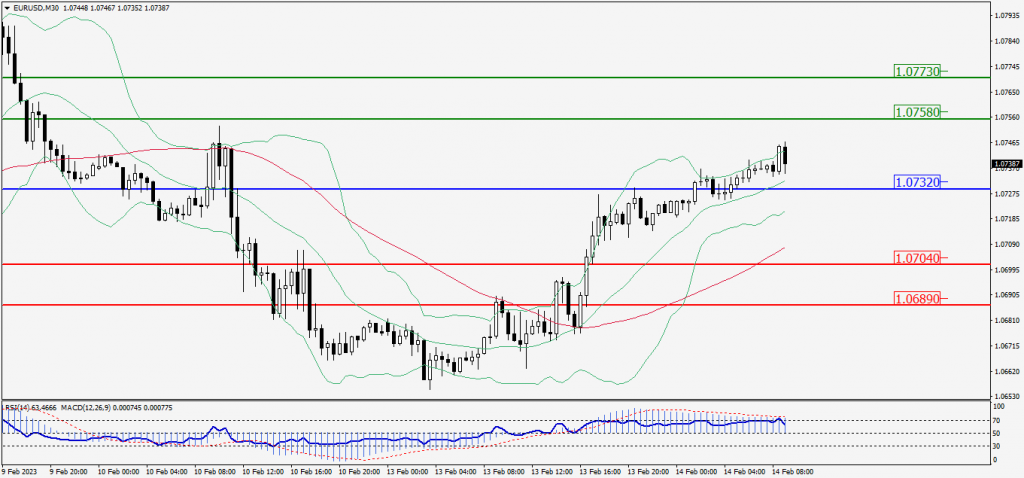
EUR/USD Intraday: Major trend on the upside
Our pivot point is at 1.07320
Preferable Price Action: Take long positions above pivot level with targets at 1.07580 & 1.07730 in extension.
Alternative Price Action: Below pivot looks for a further downside to 1.07040 & 1.06890.
Comment: RSI is above 50 levels and Pairs above its 20MA & 55MA.
Green Lines Indicate Resistance Levels – Red Lines Indicate Support Levels
Light Blue is a Pivot Point – Black represents the price when the report was produced
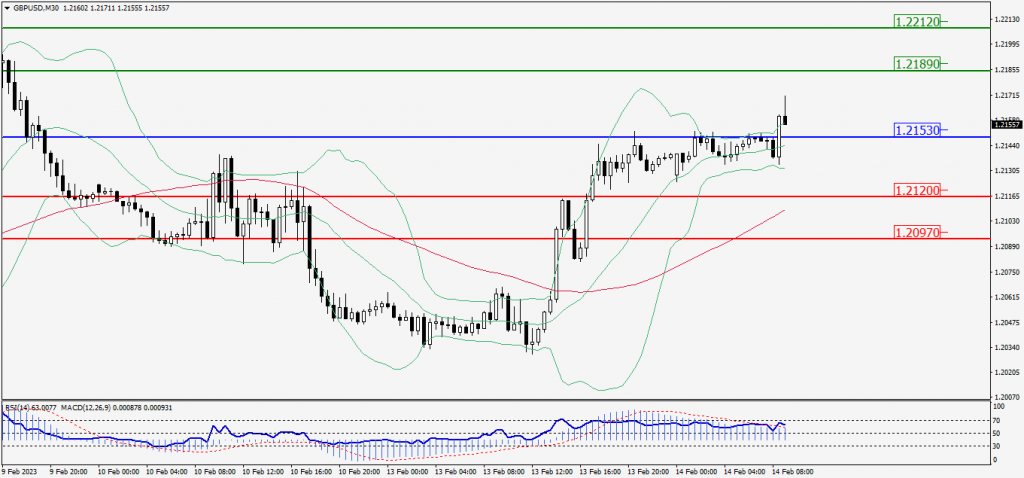
GBP/USD Intraday: Trend on the upside
Our pivot point is at 1.21530
Preferable Price Action: Buy positions above pivot with targets at 1.21890 & 1.22120 in extension.
Alternative Price Action: The price below pivot would call for further downside to 1.21200 & 1.20970.
Comment: RSI is above 50 levels and Pairs above its 20MA & 55MA.
Green Lines Indicate Resistance Levels – Red Lines Indicate Support Levels
Light Blue is a Pivot Point – Black represents the price when the report was produced
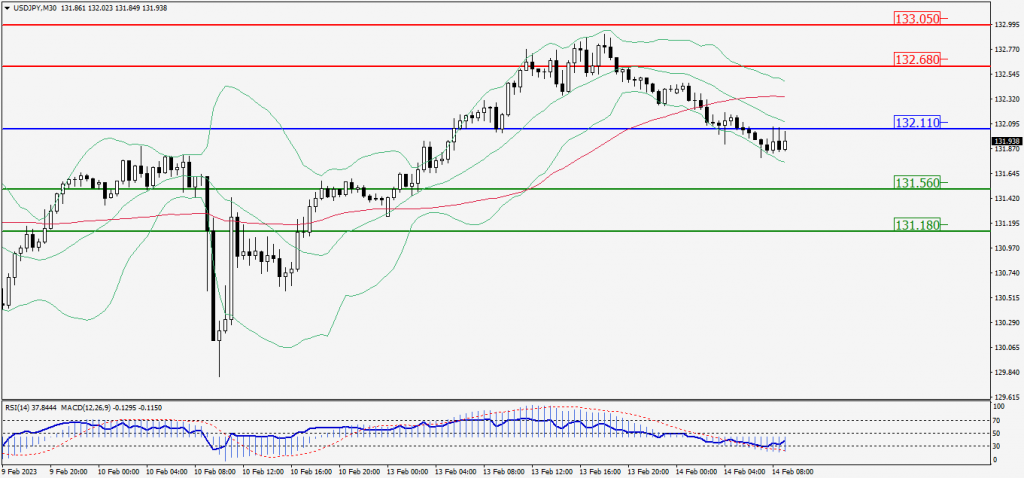
USD/JPY Intraday: Trend on the downside
Our pivot point is at 132.110
Preferable Price Action: Sell position below pivot with the target at 131.560 and 131.180 in extension.
Alternative Price Action: The upside breakout of the pivot would call for 132.680 and 133.050.
Comment: MACD is below 50 level and Pairs below its 20MA & 55MA.
Green Lines Indicate Resistance Levels – Red Lines Indicate Support Levels
Light Blue is a Pivot Point – Black represents the price when the report was produced
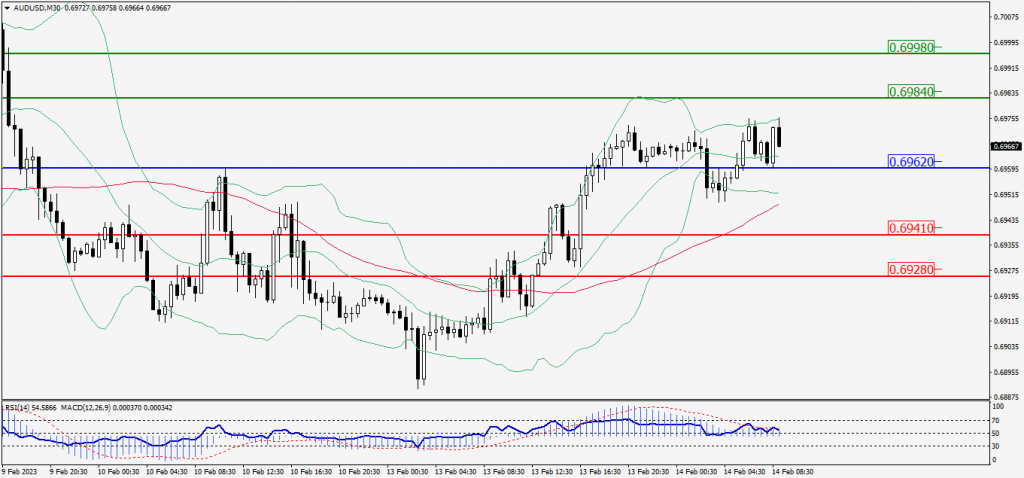
AUD/USD Intraday: Support level at 0.69620
Our pivot point is at 0.69620
Preferable Price Action: Buy positions above pivot with targets at 0.69840 & 0.69980 in extension.
Alternative Price Action: Below pivot looks for a further downside with 0.69410 & 0.69280 as targets.
Comment: RSI is above 50 levels and pairs above its 20MA & 55MA.
Green Lines Indicate Resistance Levels – Red Lines Indicate Support Levels
Light Blue is a Pivot Point – Black represents the price when the report was produced
CRUDEOIL Intraday: In a consolidation zone
Our pivot point is at 79.44
Preferable Price Action: Above pivot buy oil with 80.23 & 80.70 as targets.
Alternative Price Action: Sell crude below pivot with targets at 78.68 and 78.24 in extension.
Comment: MACD is positive territory and Pairs above its 20MA & 55MA.
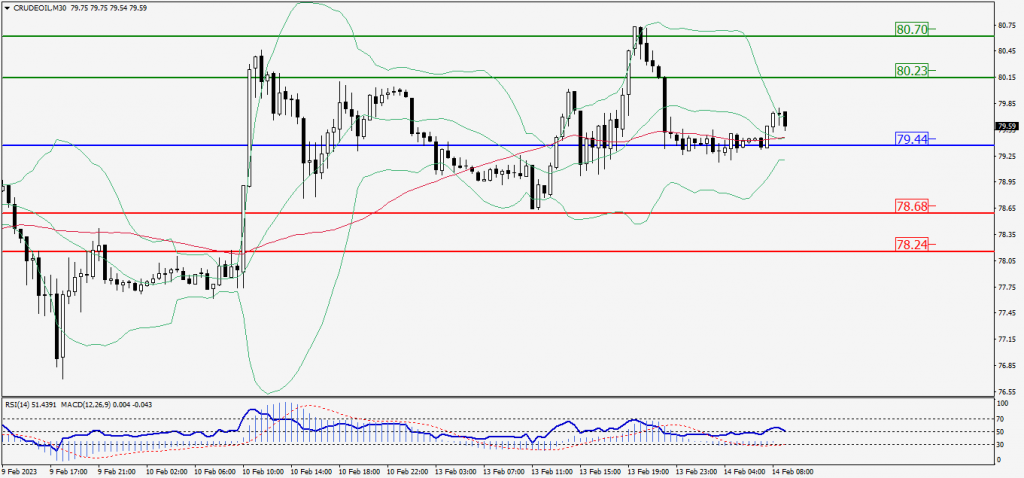
Green Lines Indicate Resistance Levels – Red Lines Indicate Support Levels
Light Blue is a Pivot Point – Black represents the price when the report was produced
XAU/USD Intraday: Support level at 1856.80
Our pivot point is 1856.80
Preferable Price Action: Further upside to 1868.70 and 1876.70
Alternative Price Action: If the price gives a downside breakout of a pivot, then the price extends to 1844.50 and 1837.10.
Comment: MACD is above 50 level and Pairs above its 20MA & 55MA.
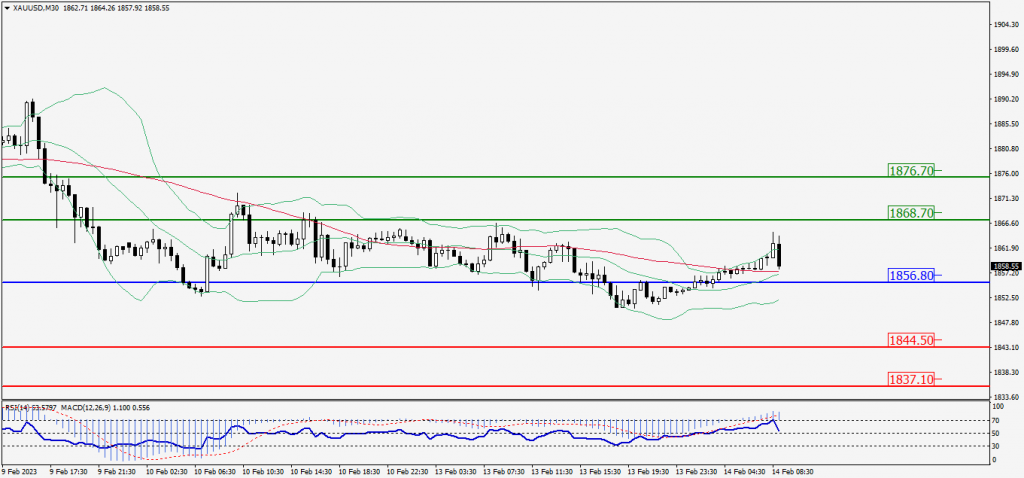
Green Lines Indicate Resistance Levels – Red Lines Indicate Support Levels
Light Blue is a Pivot Point – Black represents the price when the report was produced
Dow Jones Intraday: Trend on the upside
Our pivot point is 34,187.00
Preferable Price Action: Take buy positions above the pivot with targets at 34,359.00 & 34,445.00.
Alternative Price Action: Below 34,187.00 looks for further downside to 34,026.00 & 33,937.00.
Comment: RSI is above 50 levels and Pairs above 55MA.
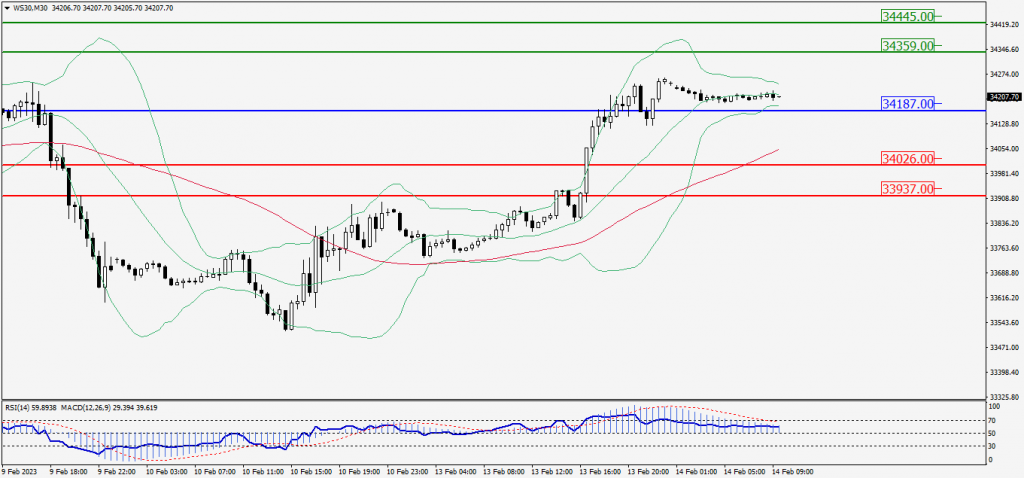
Green Lines Indicate Resistance Levels – Red Lines Indicate Support Levels
Light Blue is a Pivot Point – Black represents the price when the report was produced