Market Wrap: Stocks, Bonds, Commodities
US stocks ended down on Wednesday, paring most of the previous session’s strong gains, with tech-focused shares leading the way lower.
The Dow Jones Industrial Average fell 207.68 points to 33,949.01, the S&P 500 lose 1.11% to 4,117.86 and the Nasdaq Composite subtract 203.27 points to 11,910.52.
MSCI’s index of Asia-Pacific stocks outside Japan is ascend 0.49% to 668.44 levels. The Australian index was lower by 0.53% to 7,490.30. Japanese Nikkei Index fell 0.08% today.
European stocks were positive on Thursday, with the Stoxx Europe 50 Index gain 0.96% to 4,248.65, Germany’s DAX rose 0.95% to 15,558.82, and France’s CAC ascend 0.97% to 7,189.14, and U.K.’s FTSE 100 add 0.44% to 7,921.00.
Benchmark 10-year U.S. Treasury fell as demand for safe assets ascend again, today 10-year bond yields are negative 0.65% to 3.6120.
Oil rose for a third straight day on Thursday as investors felt more comfortable with risk a day after the Federal Reserve chair’s remarks eased concerns about future interest rate hikes.
Spot Brent crude oil rose 0.12% to $85.19 per barrel. US West Texas Intermediate crude is up 0.08% to $78.53 a barrel.
The yellow metal gold is advance 0.21% to 1,894.65 dollars per ounce.
Market Wrap: Forex
The U.S. dollar hovered near the middle of recent ranges versus major peers on Thursday as investors digested comments from a slew of Federal Reserve officials, while crucial consumer inflation data loomed next week.
Today, the U.S. dollar index measures the Greenback against a trade-weighted basket of six major currencies, which slipped 0.16% to 103.105.
The Euro US Dollar (EUR/USD) is a widely traded pair that is up 0.28% today. This left the pair trading around $1.07410.
The Japanese yen was negative against the U.S. dollar on Thursday. Today USD/JPY is decline 0.29% to the 131.000 level.
Another commodity-related currency positive against the U.S dollar, AUD/USD gain 0.69% to 0.69700, and NZD/USD rose 0.90% to 0.63620 level.
EUR/USD Intraday: Support level at 1.07300
Our pivot point is at 1.07300
Preferable Price Action: Take long positions above pivot level with targets at 1.07760 & 1.08130 in extension.
Alternative Price Action: Below pivot looks for a further downside to 1.06890 & 1.06560.
Comment: RSI is above 50 levels and Pairs above its 20MA & 55MA.
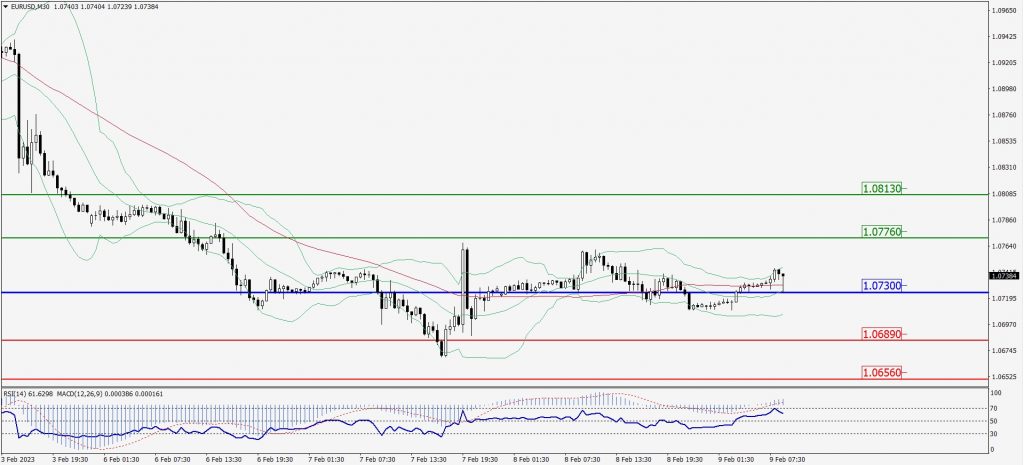
Green Lines Indicate Resistance Levels – Red Lines Indicate Support Levels
Light Blue is a Pivot Point – Black represents the price when the report was produced
GBP/USD Intraday: Major trend on the upside
Our pivot point is at 1.20980
Preferable Price Action: Buy positions above pivot with targets at 1.21460 & 1.21840 in extension.
Alternative Price Action: The price below pivot would call for further downside to 1.20510 & 1.20190.
Comment: RSI is above 50 levels and Pairs above its 20MA & 55MA.
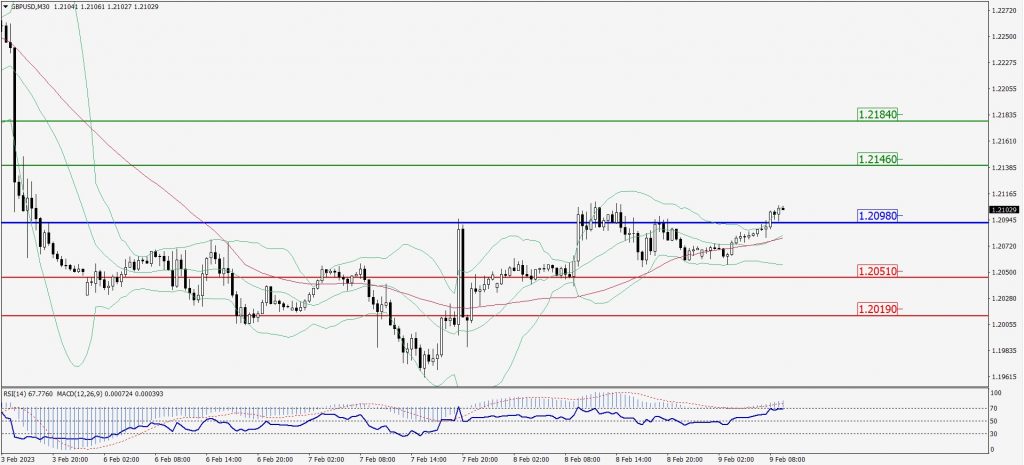
Green Lines Indicate Resistance Levels – Red Lines Indicate Support Levels
Light Blue is a Pivot Point – Black represents the price when the report was produced
USD/JPY Intraday: Resistance level at 131.580
Our pivot point is at 131.580
Preferable Price Action: Sell position below pivot with the target at 130.800 and 130.200 in extension.
Alternative Price Action: The upside breakout of the pivot would call for 132.380 and 133.040.
Comment: MACD is below 50 level and Pairs below 20MA.
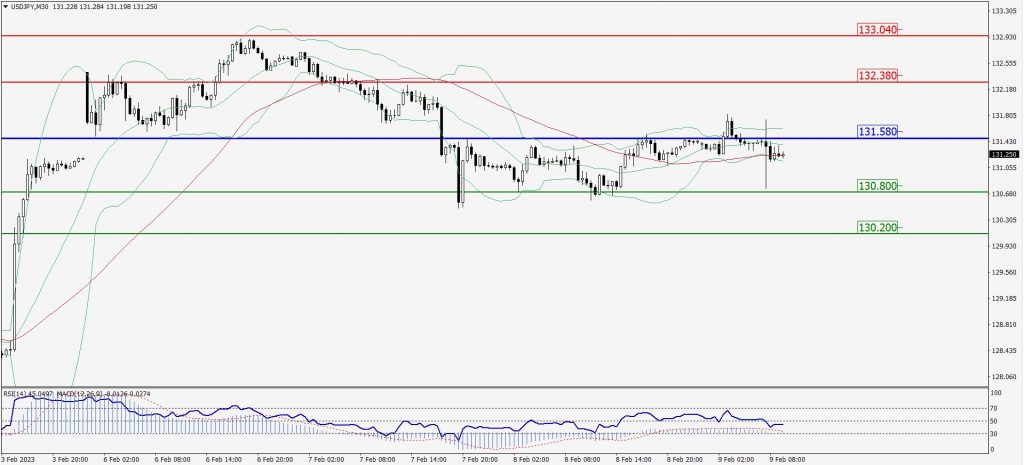
Green Lines Indicate Resistance Levels – Red Lines Indicate Support Levels
Light Blue is a Pivot Point – Black represents the price when the report was produced
AUD/USD Intraday: Trend on the upside
Our pivot point is at 0.69580
Preferable Price Action: Buy positions above pivot with targets at 0.70070 & 0.70450 in extension.
Alternative Price Action: Below pivot looks for a further downside with 0.69170 & 0.68850 as targets.
Comment: RSI is above 50 levels and pairs above its 20MA & 55MA.
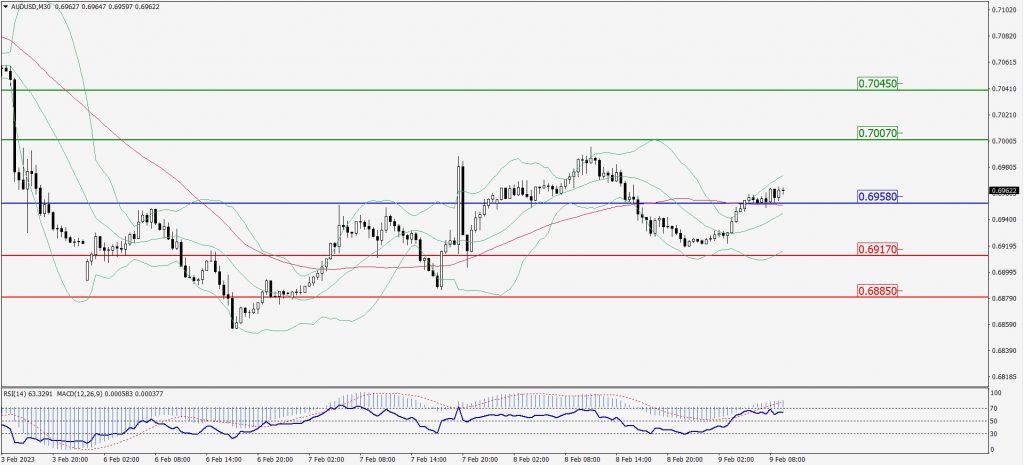
Green Lines Indicate Resistance Levels – Red Lines Indicate Support Levels
Light Blue is a Pivot Point – Black represents the price when the report was produced
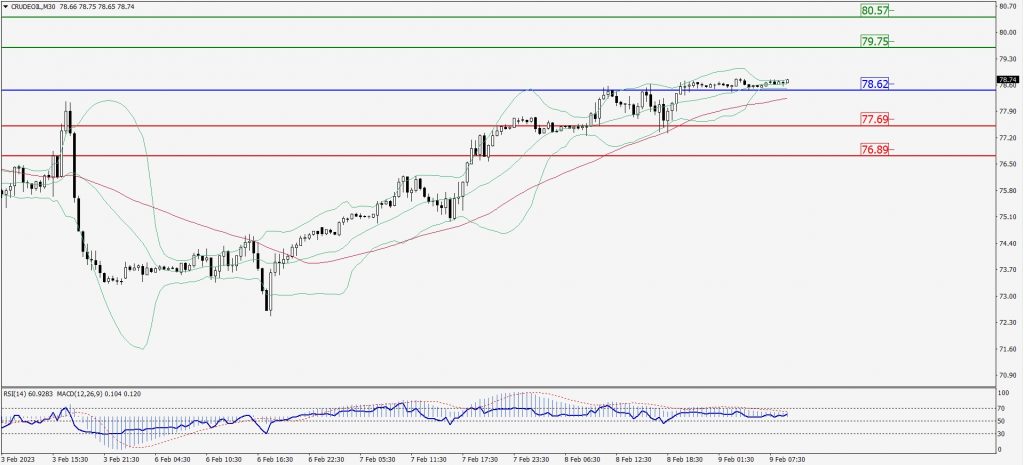
CRUDEOIL Intraday: Trend on the upside
Our pivot point is at 78.62
Preferable Price Action: Above pivot buy oil with 79.75 & 80.57 as targets.
Alternative Price Action: Sell crude below pivot with targets at 77.69 and 76.89 in extension.
Comment: MACD is positive territory and Pairs above its 20MA & 55MA.
 0
0
Green Lines Indicate Resistance Levels – Red Lines Indicate Support Levels
Light Blue is a Pivot Point – Black represents the price when the report was produced
XAU/USD Intraday: Trend on the upside
Our pivot point is 1879.10
Preferable Price Action: Further upside to 1889.50 and 1897.30
Alternative Price Action: If the price gives a downside breakout of a pivot, then the price extends to 1870.00 and 1862.20.
Comment: MACD is above 50 level and Pairs above its 20MA & 55MA.
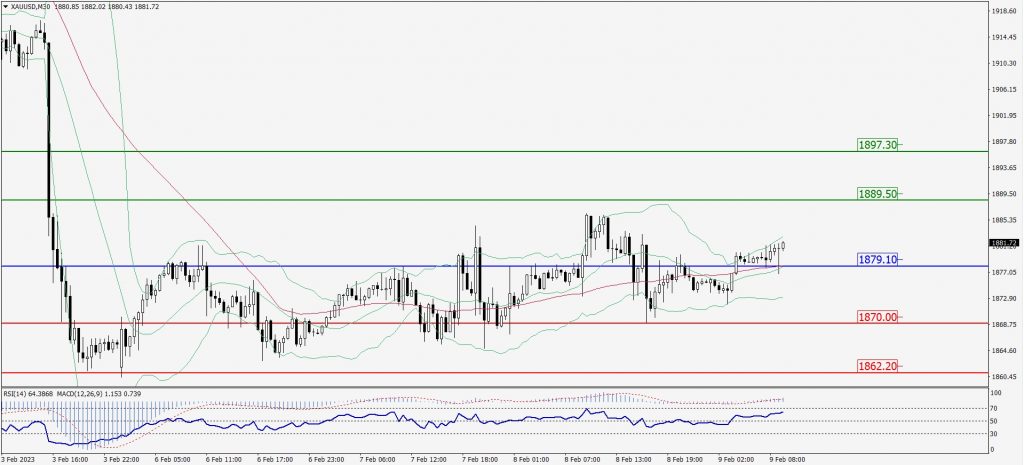
Green Lines Indicate Resistance Levels – Red Lines Indicate Support Levels
Light Blue is a Pivot Point – Black represents the price when the report was produced
Dow Jones Intraday: Trend on the upside
Our pivot point is 34,049.00
Preferable Price Action: Take buy positions above the pivot with targets at 34,152.00 & 34,229.00.
Alternative Price Action: Below 34,049.00 looks for further downside to 33,960.00 & 33,890.00.
Comment: RSI is above 50 levels and Pairs above 20MA.
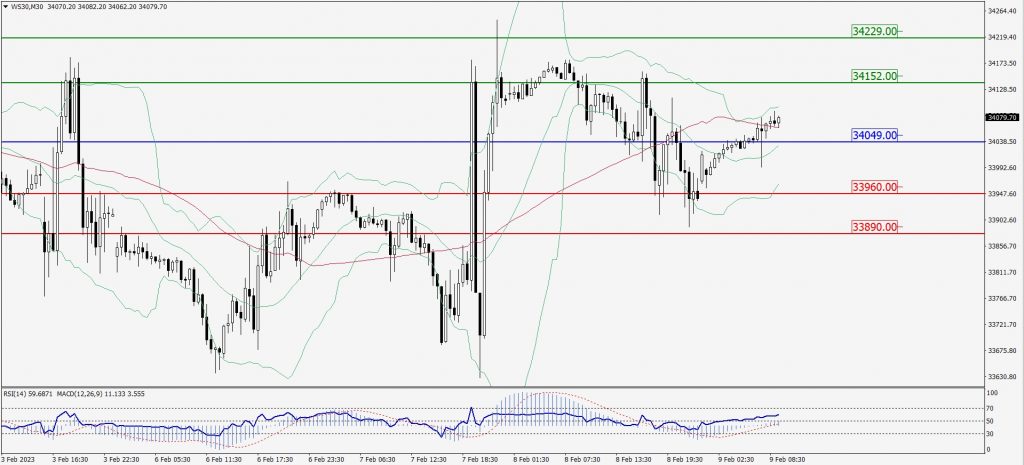
Green Lines Indicate Resistance Levels – Red Lines Indicate Support Levels
Light Blue is a Pivot Point – Black represents the price when the report was produced