Market Wrap: Stocks, Bonds, Commodities
Asian shares turned lower and the dollar regained some of its footing on Friday, as disappointing earnings from U.S. tech giants undermined sentiment ahead of a key U.S. non-farm payrolls report.
The Dow Jones Industrial Average fell 39.02 points to 34,053.94, the S&P 500 gain 1.47% to 4,179.76 and the Nasdaq Composite add 384.50 points to 12,200.82.
MSCI’s index of Asia-Pacific stocks outside Japan is decline 0.57% to 676.06 levels. The Australian index was higher by 0.62% to 7,558.10. Japanese Nikkei Index rose 0.40% today.
European stocks were positive on Friday, with the Stoxx Europe 50 Index rose 1.67% to 4,241.12, Germany’s DAX gain 2.16% to 15,509.19, and France’s CAC advance 1.26% to 7,166.27, and U.K.’s FTSE 100 add 0.76% to 7,820.16.
Benchmark 10-year U.S. Treasury fell as demand for safe assets ascend again, today 10-year bond yields are negative 0.44% to 3.3830.
Oil prices made modest gains in early trade on Friday but were heading for a second straight week of losses, as the market looked for more signs of a strong recovery in fuel demand in China to offset looming slumps in other major economies.
Spot Brent crude oil fell 0.19% to $82.01 per barrel. US West Texas Intermediate crude is down 0.24% to $75.70 a barrel.
The yellow metal gold is decline 0.01% to 1,930.60 dollars per ounce.
Market Wrap: Forex
Most Asian currencies weakened on Friday, while the dollar rebounded in anticipation of more cues on the U.S. economy from nonfarm payrolls data, while markets dialed back bets on an imminent pause in the Federal Reserve’s rate hike cycle.
Today, the U.S. dollar index measures the Greenback against a trade-weighted basket of six major currencies, which surge 0.05% to 101.625.
The Euro US Dollar (EUR/USD) is a widely traded pair that is down 0.07% today. This left the pair trading around $1.0903.
The Japanese yen was negative against the U.S. dollar on Friday. Today USD/JPY is decline 0.11% to the 128.500 level.
Another commodity-related currency mix against the U.S dollar, AUD/USD fell 0.07% to 0.70710, and NZD/USD gain 0.02% to 0.64780 level.
EUR/USD Intraday: In a consolidation zone
Our pivot point is at 1.09120
Preferable Price Action: Take short positions below pivot level with targets at 1.08750 & 1.08540 in extension.
Alternative Price Action: Above pivot looks for a further upside to 1.09510 & 1.09740.
Comment: RSI is at 50 levels and Pairs below 55MA.
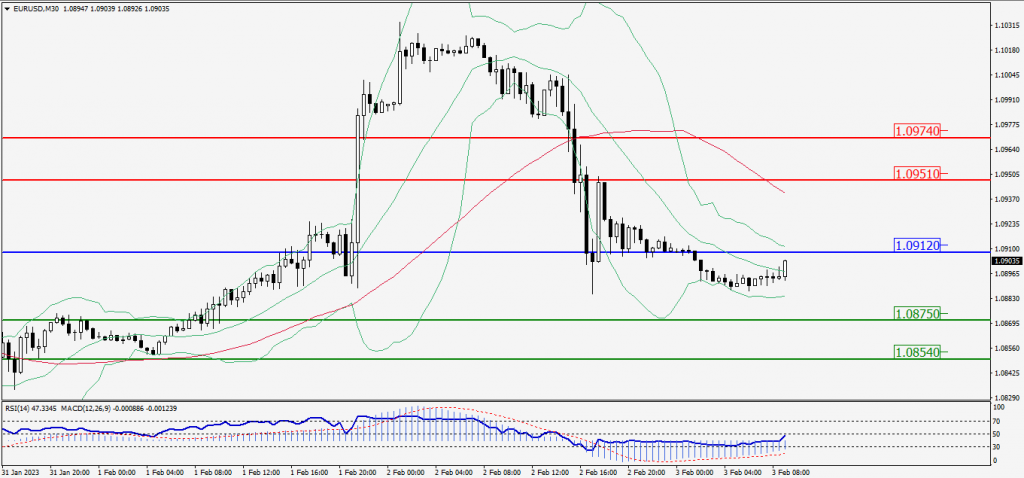
Green Lines Indicate Resistance Levels – Red Lines Indicate Support Levels
Light Blue is a Pivot Point – Black represents the price when the report was produced
GBP/USD Intraday: Trend on the downside
Our pivot point is at 1.22430
Preferable Price Action: Sell positions below pivot with targets at 1.21890 & 1.21560 in extension.
Alternative Price Action: The price above pivot would call for further upside to 1.22950 & 1.23280.
Comment: RSI is below 50 levels and Pairs below 55MA.
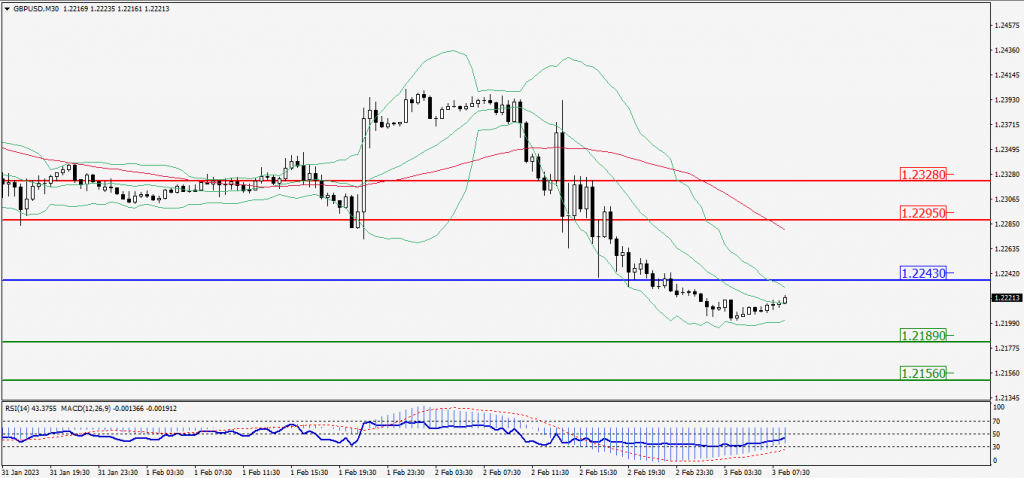
Green Lines Indicate Resistance Levels – Red Lines Indicate Support Levels
Light Blue is a Pivot Point – Black represents the price when the report was produced
USD/JPY Intraday: Resistance level at 128.720
Our pivot point is at 128.720
Preferable Price Action: Sell position below pivot with the target at 128.250 and 127.910 in extension.
Alternative Price Action: The upside breakout of the pivot would call for 129.190 and 129.530.
Comment: MACD is below 50 level and Pairs below 20MA.
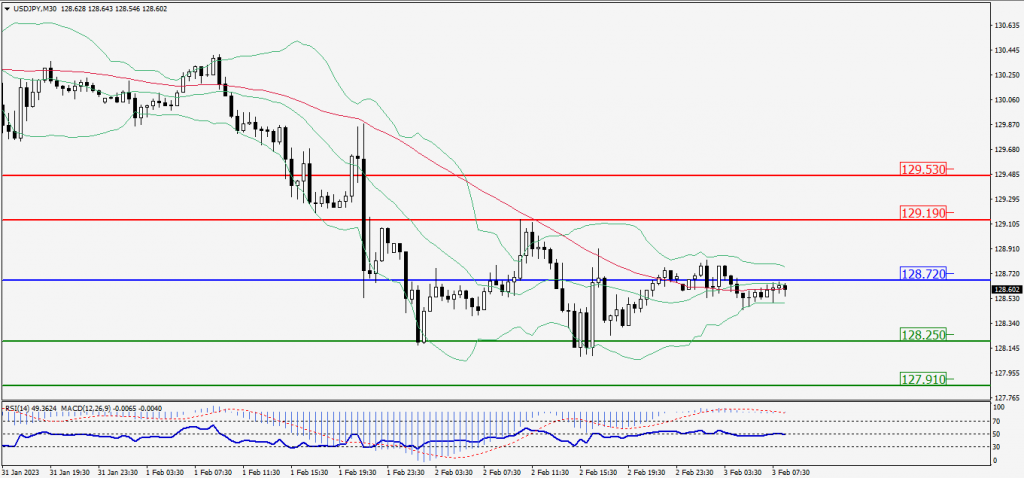
Green Lines Indicate Resistance Levels – Red Lines Indicate Support Levels
Light Blue is a Pivot Point – Black represents the price when the report was produced
AUD/USD Intraday: Resistance level at 0.70750
Our pivot point is at 0.70750
Preferable Price Action: Sell positions below pivot with targets at 0.70470 & 0.70320 in extension.
Alternative Price Action: Above pivot looks for a further upside with 0.71050 & 0.71210 as targets.
Comment: RSI is below 50 levels and pairs below 55MA.
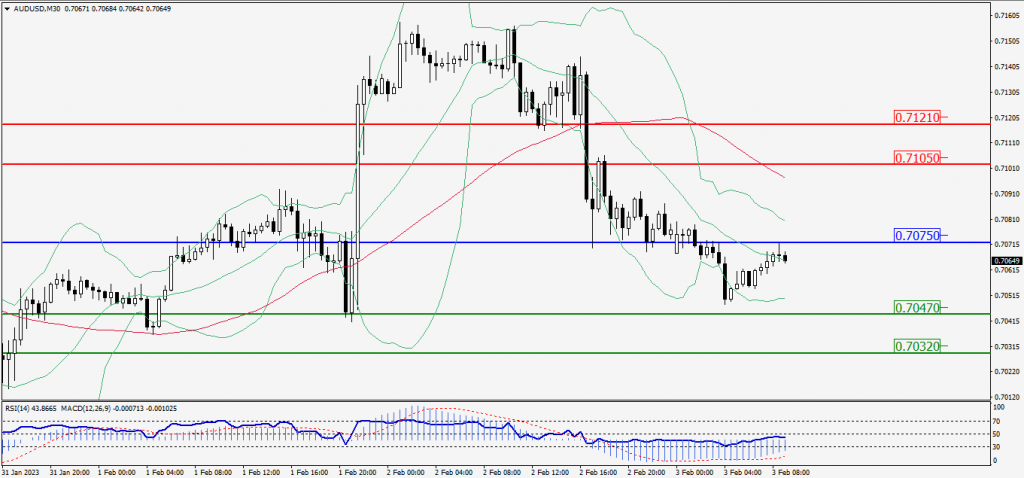
Green Lines Indicate Resistance Levels – Red Lines Indicate Support Levels
Light Blue is a Pivot Point – Black represents the price when the report was produced
CRUDEOIL Intraday: Trend on the downside
Our pivot point is at 76.24
Preferable Price Action: Below pivot sell oil with 74.99 & 74.10 as targets.
Alternative Price Action: Buy crude above pivot with targets at 77.56 and 78.40 in extension.
Comment: MACD is negative territory and Pairs below its 20MA & 55MA.
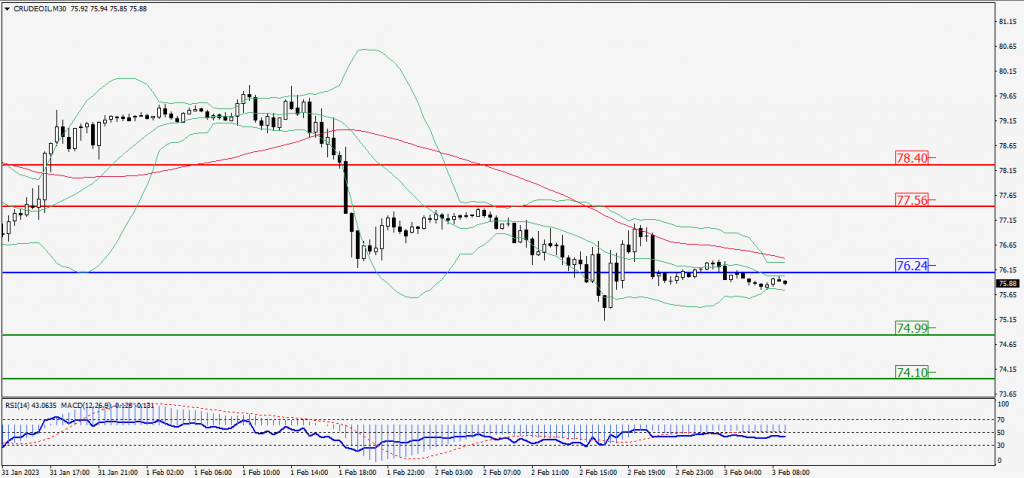
Green Lines Indicate Resistance Levels – Red Lines Indicate Support Levels
Light Blue is a Pivot Point – Black represents the price when the report was produced
XAU/USD Intraday: Trend on the downside
Our pivot point is 1921.10
Preferable Price Action: Further downside to 1910.10 and 1903.10
Alternative Price Action: If the price gives an upside breakout of a pivot, then the price extends to 1932.50 and 1939.30.
Comment: MACD is below 50 level and Pairs below 55MA.
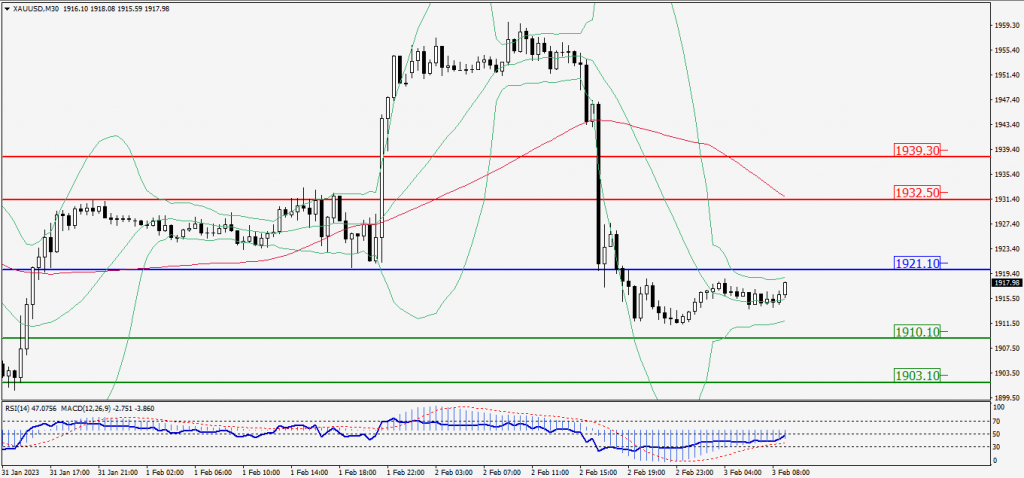
Green Lines Indicate Resistance Levels – Red Lines Indicate Support Levels
Light Blue is a Pivot Point – Black represents the price when the report was produced
Dow Jones Intraday: In a consolidation zone
Our pivot point is 34,001.00
Preferable Price Action: Take buy positions above the pivot with targets at 34,150.00 & 34,247.00.
Alternative Price Action: Below 34,001.00 looks for further downside to 33,850.00 & 33,756.00.
Comment: RSI is at 50 levels and Pairs above its 55MA.
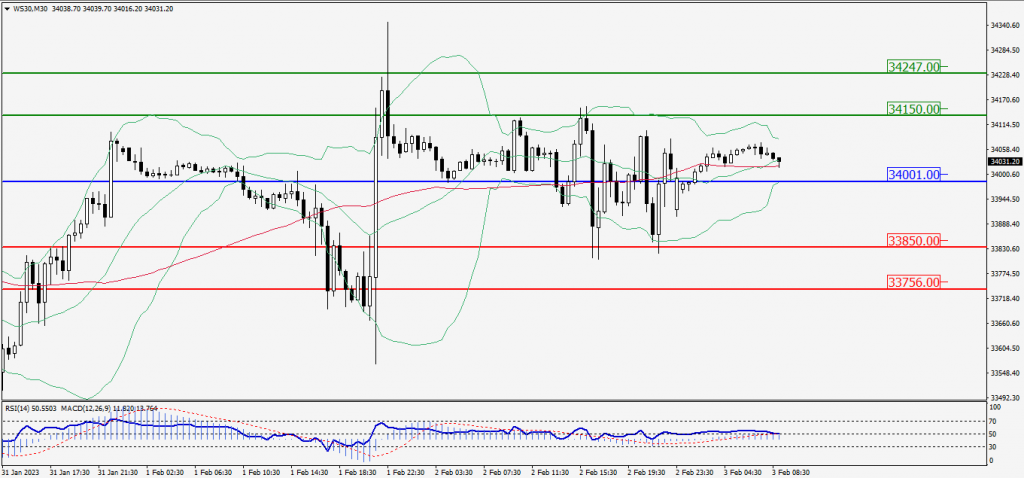
Green Lines Indicate Resistance Levels – Red Lines Indicate Support Levels
Light Blue is a Pivot Point – Black represents the price when the report was produced