Market Wrap: Stocks, Bonds, Commodities
Wall Street advanced on Friday, marking the end of an rocky week in which economic data and corporate earnings guidance hinted at softening demand but also economic resiliency ahead of next week’s Federal Reserve monetary policy meeting.
The Dow Jones Industrial Average rose 28.67 points to 33,978.08, the S&P 500 gain 0.25% to 4,070.56 and the Nasdaq Composite add 109.30 points to 11,621.71.
MSCI’s index of Asia-Pacific stocks outside Japan is drop 0.83% to 678.86 levels. The Australian index was lower by 0.16% to 7,481.70. Japanese Nikkei Index gain 0.19% today.
European stocks were negative on Monday, with the Stoxx Europe 50 Index fell 0.60% to 4,153.05, Germany’s DAX lose 0.41% to 15,087.85, and France’s CAC decline 0.48% to 7,063.42, and U.K.’s FTSE 100 subtract 0.35% to 7,738.20.
Benchmark 10-year U.S. Treasury fell as demand for safe assets ascend again, today 10-year bond yields are negative 0.63% to 3.4960.
Oil prices fell on Monday, giving up earlier gains, as global producers this week will likely keep output unchanged during a meeting this week and investors are cautious ahead of a U.S. Federal Reserve meeting that may spur market volatility.
Spot Brent crude oil fell 0.57% to $85.91 per barrel. US West Texas Intermediate crude is down 0.70% to $79.12 a barrel.
The yellow metal gold is decline 0.32% to 1,923.30 dollars per ounce.
Market Wrap: Forex
The Chinese yuan rose sharply on Monday as local markets reopened from a week-long holiday, while most other Asian currencies strengthened in anticipation of a Federal Reserve meeting and a slew of economic data releases this week.
Today, the U.S. dollar index measures the Greenback against a trade-weighted basket of six major currencies, which surge 0.03% to 101.750.
The Euro US Dollar (EUR/USD) is a widely traded pair that is up 0.06% today. This left the pair trading around $1.08730.
The Japanese yen was negative against the U.S. dollar on Monday. Today USD/JPY is drop 0.07% to the 129.760 level.
Another commodity-related currency negative against the U.S dollar, AUD/USD fell 0.33% to 0.70790, and NZD/USD lose 0.18% to 0.64810 level.
EUR/USD Intraday: In a consolidation zone
Our pivot point is at 1.08720
Preferable Price Action: Take short positions below pivot level with targets at 1.08530 & 1.08430 in extension.
Alternative Price Action: Above pivot looks for a further upside to 1.08900 & 1.09010.
Comment: RSI is at 50 levels and Pairs below its 20MA & 55MA.
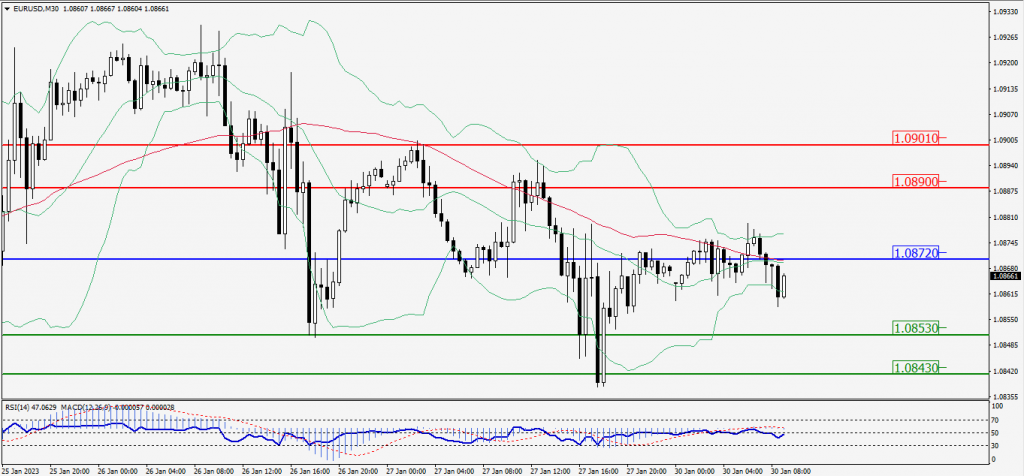
Green Lines Indicate Resistance Levels – Red Lines Indicate Support Levels
Light Blue is a Pivot Point – Black represents the price when the report was produced
GBP/USD Intraday: Resistance level at 1.23830
Our pivot point is at 1.23830
Preferable Price Action: Sell positions below pivot with targets at 1.23600 & 1.23470 in extension.
Alternative Price Action: The price above pivot would call for further upside to 1.24060 & 1.24200.
Comment: RSI is below 50 levels and Pairs below 20MA.
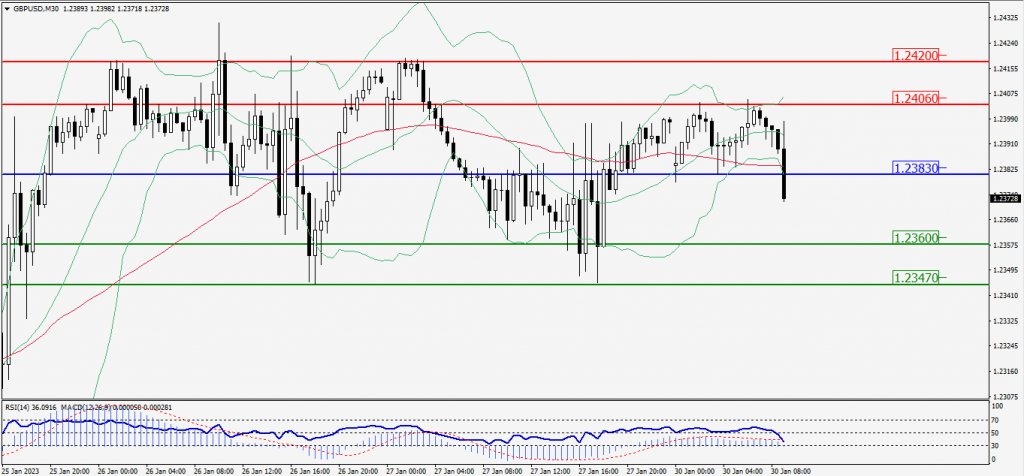
Green Lines Indicate Resistance Levels – Red Lines Indicate Support Levels
Light Blue is a Pivot Point – Black represents the price when the report was produced
USD/JPY Intraday: Trend on the downside
Our pivot point is at 129.580
Preferable Price Action: Sell position below pivot with the target at 129.300 and 129.120 in extension.
Alternative Price Action: The upside breakout of the pivot would call for 129.870 and 130.050.
Comment: MACD is below 50 level and Pairs below its 20MA & 55MA.
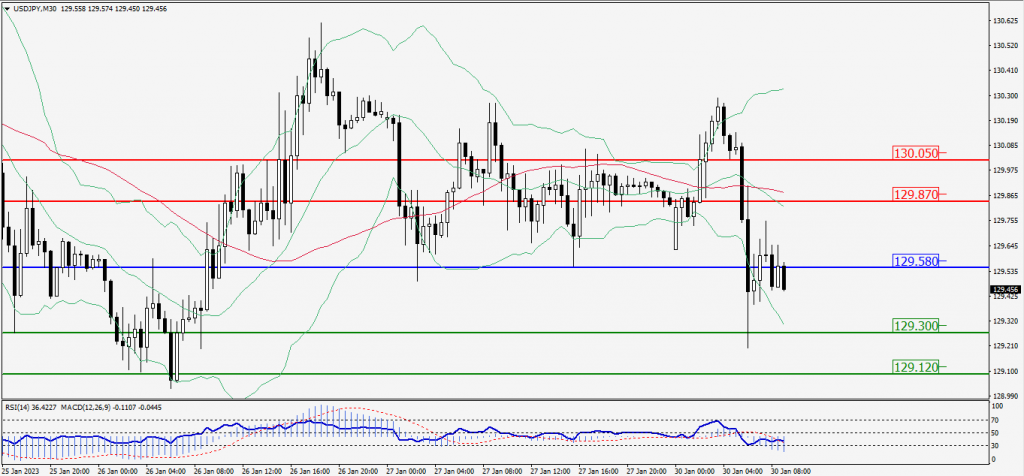
Green Lines Indicate Resistance Levels – Red Lines Indicate Support Levels
Light Blue is a Pivot Point – Black represents the price when the report was produced
AUD/USD Intraday: Trend on the downside
Our pivot point is at 0.70850
Preferable Price Action: Sell positions below pivot with targets at 0.70630 & 0.70490 in extension.
Alternative Price Action: Above pivot looks for a further upside with 0.71080 & 0.71210 as targets.
Comment: RSI is below 50 levels and pairs below its 20MA & 55MA.
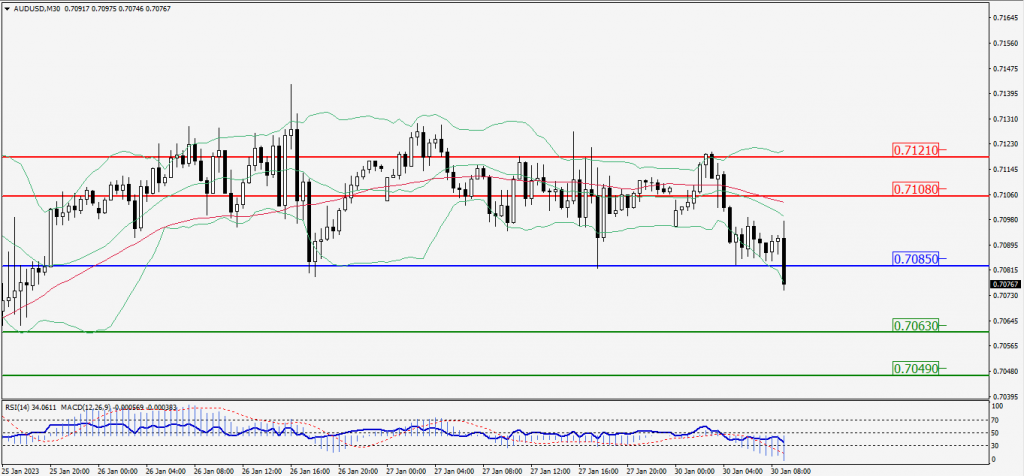
Green Lines Indicate Resistance Levels – Red Lines Indicate Support Levels
Light Blue is a Pivot Point – Black represents the price when the report was produced
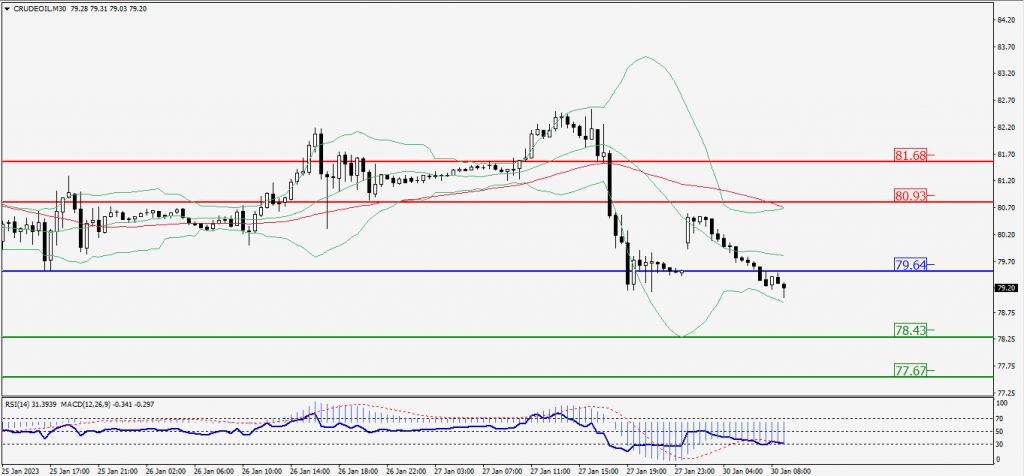
CRUDEOIL Intraday: Major trend on the downside
Our pivot point is at 79.64
Preferable Price Action: Below pivot sell oil with 78.43 & 77.67 as targets.
Alternative Price Action: Buy crude above pivot with targets at 80.93 and 81.68 in extension.
Comment: MACD is negative territory and Pairs below its 20MA & 55MA.
Green Lines Indicate Resistance Levels – Red Lines Indicate Support Levels
Light Blue is a Pivot Point – Black represents the price when the report was produced
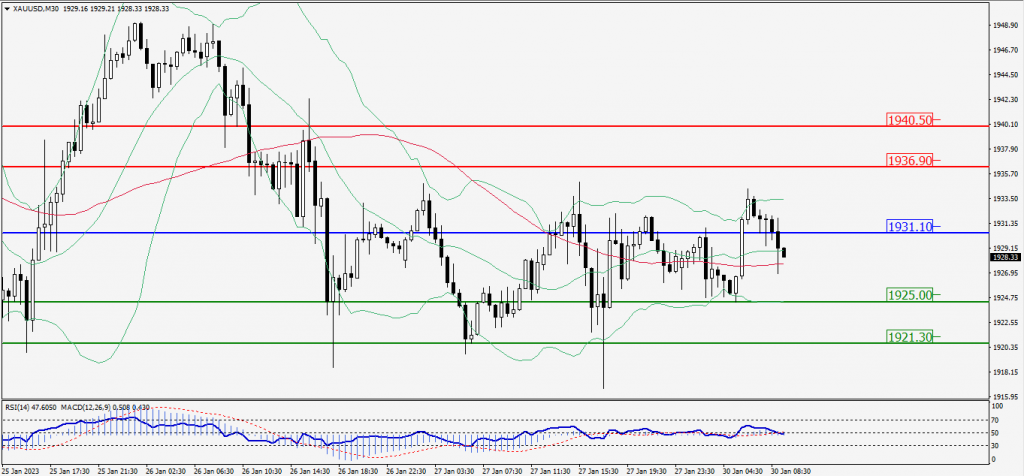
XAU/USD Intraday: In a consolidation zone
Our pivot point is 1931.10
Preferable Price Action: Further downside to 1925.00 and 1921.30
Alternative Price Action: If the price gives an upside breakout of a pivot, then the price extends to 1936.90 and 1940.50.
Comment: MACD is at 50 level and Pairs below 20MA.
Green Lines Indicate Resistance Levels – Red Lines Indicate Support Levels
Light Blue is a Pivot Point – Black represents the price when the report was produced
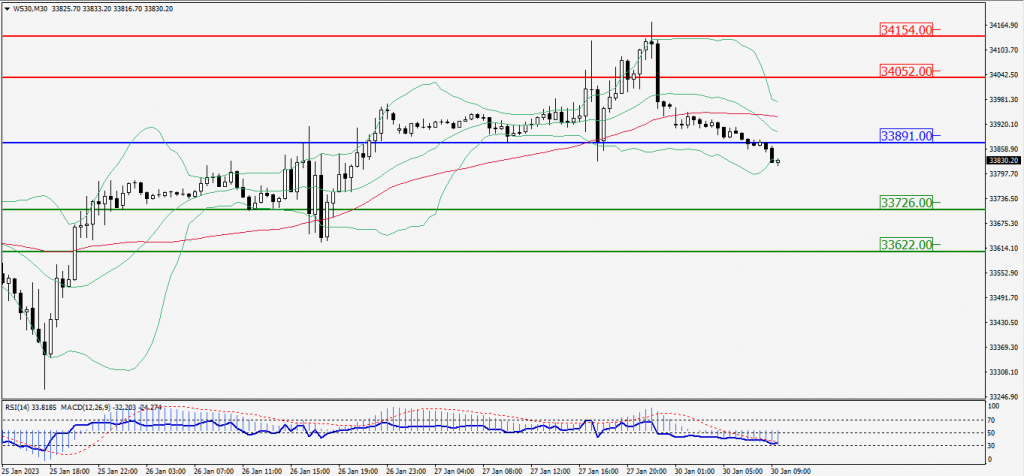
Dow Jones Intraday: Major trend on the downside
Our pivot point is 33,891.00
Preferable Price Action: Take sell positions down the pivot with targets at 33,726.00 & 33,622.00.
Alternative Price Action: Above 33,891.00 looks for further upside to 34,052.00 & 34,154.00.
Comment: RSI is below 50 levels and Pairs below its 20MA & 55MA.
Green Lines Indicate Resistance Levels – Red Lines Indicate Support Levels
Light Blue is a Pivot Point – Black represents the price when the report was produced