Market Wrap: Stocks, Bonds, Commodities
Wall Street ended a choppy session higher on Thursday as investors grappled with an onslaught of economic data and a string of mixed corporate earnings, all while eyeing the clock as it ticks down toward next week’s Federal Reserve monetary policy meeting.
The Dow Jones Industrial Average rose 205.57 points to 33,949.41, the S&P 500 gain 1.10% to 4,060.43 and the Nasdaq Composite add 199.06 points to 11,512.41.
MSCI’s index of Asia-Pacific stocks outside Japan is ascend 0.01% to 684.23 levels. The Australian index was higher by 0.34% to 7,493.80. Japanese Nikkei Index gain 0.07% today.
European stocks were mix on Friday, with the Stoxx Europe 50 Index fell 0.14% to 4,168.25, Germany’s DAX gain 0.03% to 15,137.85, and France’s CAC decline 0.20% to 7,081.63, and U.K.’s FTSE 100 subtract 0.06% to 7,756.74.
Benchmark 10-year U.S. Treasury fell as demand for safe assets ascend again, today 10-year bond yields are positive 0.99% to 3.5260.
Oil prices rose more than 1% on Thursday on expectations that global demand will strengthen as top oil importer China reopens its economy and on positive US economic data.
Spot Brent crude oil rose 0.34% to $87.81 per barrel. US West Texas Intermediate crude is up 0.49% to $81.41 a barrel.
The yellow metal gold is decline 0.35% to 1,923.25 dollars per ounce.
Market Wrap: Forex
Most Asian currencies kept to a tight range on Friday in anticipation of the Federal Reserve’s preferred inflation gauge, while the Japanese yen rose as higher-than-expected Tokyo inflation readings fed into expectations for more hawkish moves by the Bank of Japan.
Today, the U.S. dollar index measures the Greenback against a trade-weighted basket of six major currencies, which surge 0.15% to 101.790.
The Euro US Dollar (EUR/USD) is a widely traded pair that is down 0.19% today. This left the pair trading around $1.08680.
The Japanese yen was negative against the U.S. dollar on Friday. Today USD/JPY is drop 0.22% to the 129.930 level.
Another commodity-related currency negative against the U.S dollar, AUD/USD fell 0.25% to 0.70960, and NZD/USD lose 0.08% to 0.64820 level.
EUR/USD Intraday: Trend on the downside
Our pivot point is at 1.08790
Preferable Price Action: Take short positions below pivot level with targets at 1.08610 & 1.08500 in extension.
Alternative Price Action: Above pivot looks for a further upside to 1.08970 & 1.09090.
Comment: RSI is below 50 levels and Pairs below its 20MA & 55MA.
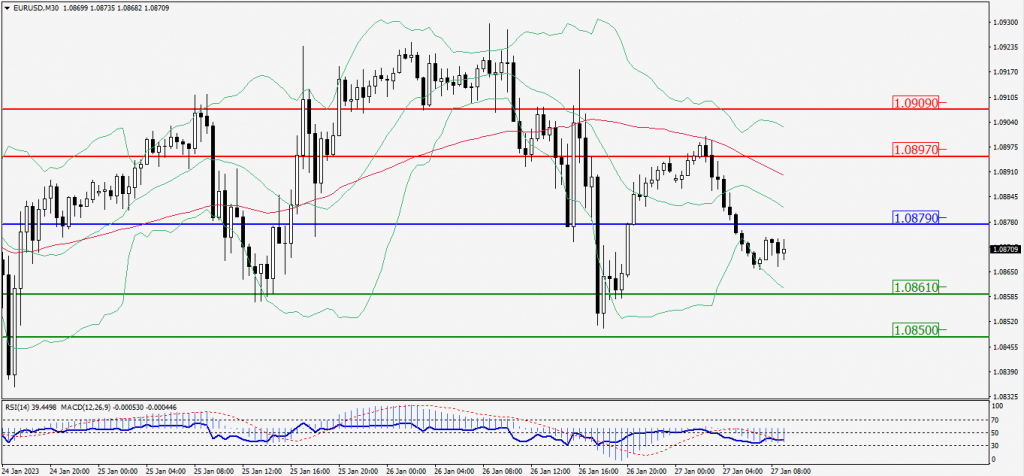
Green Lines Indicate Resistance Levels – Red Lines Indicate Support Levels
Light Blue is a Pivot Point – Black represents the price when the report was produced
GBP/USD Intraday: Resistance level at 1.23840
Our pivot point is at 1.23840
Preferable Price Action: Sell positions below pivot with targets at 1.23550 & 1.23350 in extension.
Alternative Price Action: The price above pivot would call for further upside to 1.24120 & 1.24310.
Comment: RSI is below 50 levels and Pairs below its 20MA & 55MA.
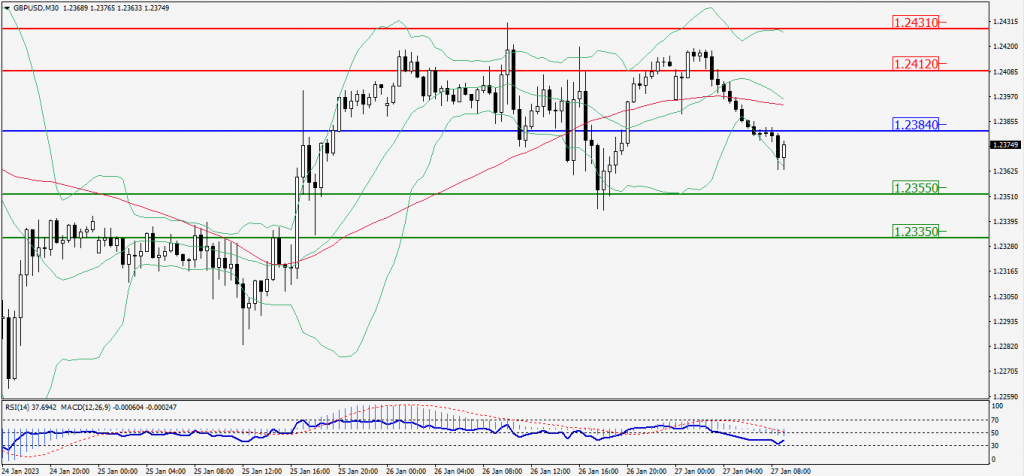
Green Lines Indicate Resistance Levels – Red Lines Indicate Support Levels
Light Blue is a Pivot Point – Black represents the price when the report was produced
USD/JPY Intraday: Support level at 130.020
Our pivot point is at 130.020
Preferable Price Action: Buy position above pivot with the target at 130.400 and 130.640 in extension.
Alternative Price Action: The downside breakout of the pivot would call for 129.650 and 129.410.
Comment: MACD is above 50 level and Pairs above its 20MA & 55MA.
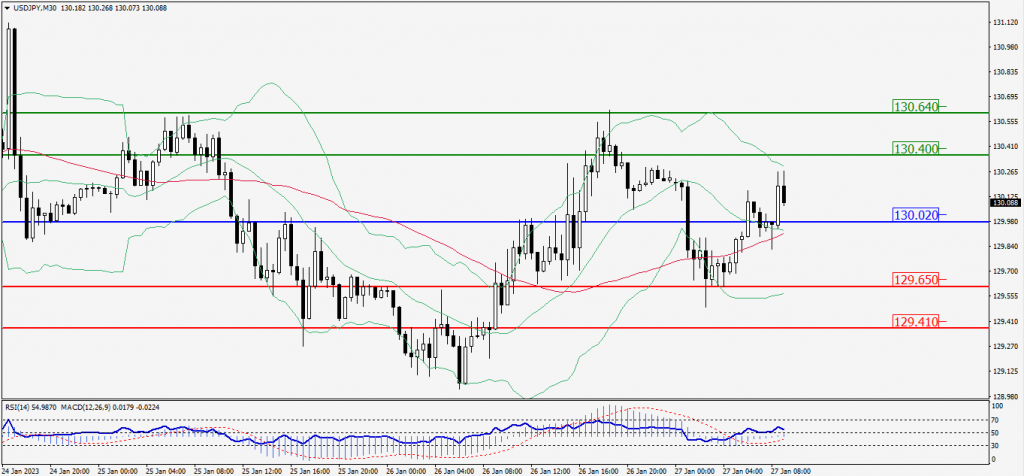
Green Lines Indicate Resistance Levels – Red Lines Indicate Support Levels
Light Blue is a Pivot Point – Black represents the price when the report was produced
AUD/USD Intraday: Trend on the downside
Our pivot point is at 0.71120
Preferable Price Action: Sell positions below pivot with targets at 0.70770 & 0.70560 in extension.
Alternative Price Action: Above pivot looks for a further upside with 0.71490 & 0.71700 as targets.
Comment: RSI is below 50 levels and pairs below its 20MA & 55MA.
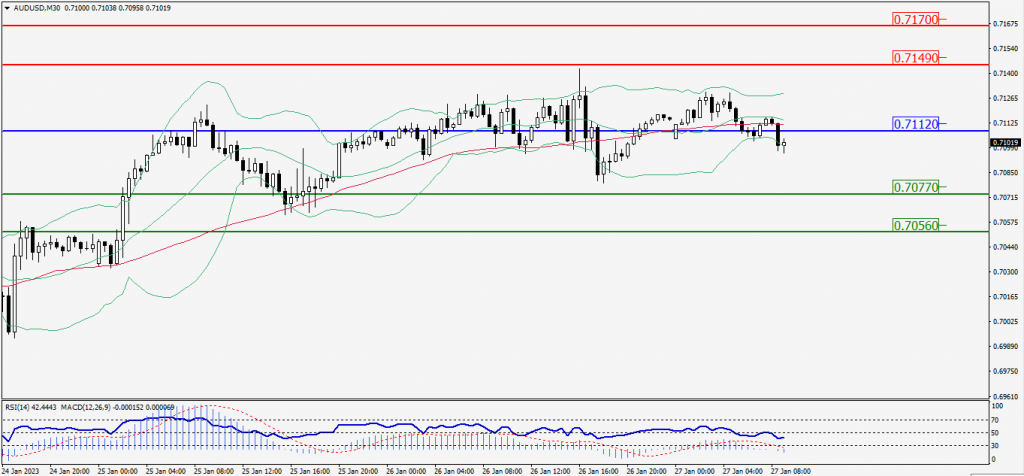
Green Lines Indicate Resistance Levels – Red Lines Indicate Support Levels
Light Blue is a Pivot Point – Black represents the price when the report was produced
CRUDEOIL Intraday: In a consolidation zone
Our pivot point is at 81.51
Preferable Price Action: Below pivot sell oil with 80.96 & 80.66 as targets.
Alternative Price Action: Buy crude above pivot with targets at 82.05 and 82.37 in extension.
Comment: MACD is flat territory and Pairs below 20MA.
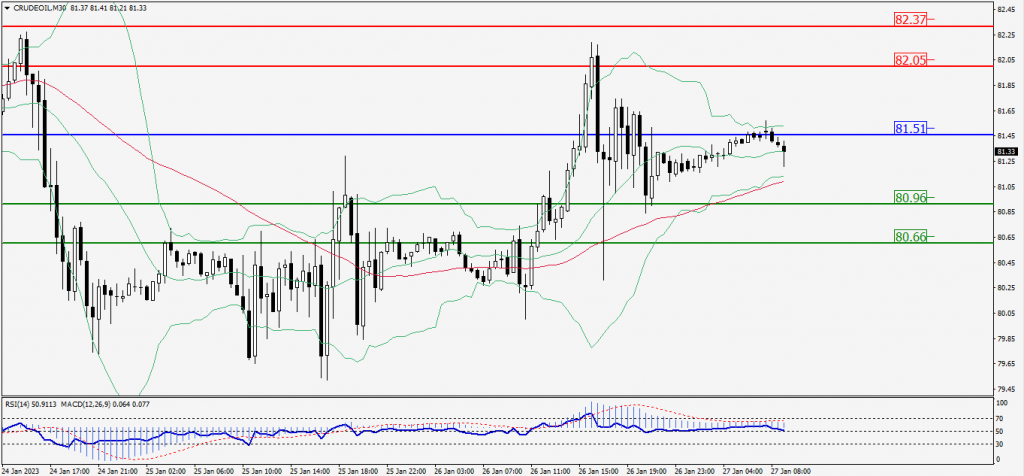
Green Lines Indicate Resistance Levels – Red Lines Indicate Support Levels
Light Blue is a Pivot Point – Black represents the price when the report was produced
XAU/USD Intraday: Resistance level at 1926.80
Our pivot point is 1926.80
Preferable Price Action: Further downside to 1919.60 and 1915.60
Alternative Price Action: If the price gives a upside breakout of a pivot, then the price extends to 1933.50 and 1937.70.
Comment: MACD is below 50 level and Pairs below its 20MA & 55MA.
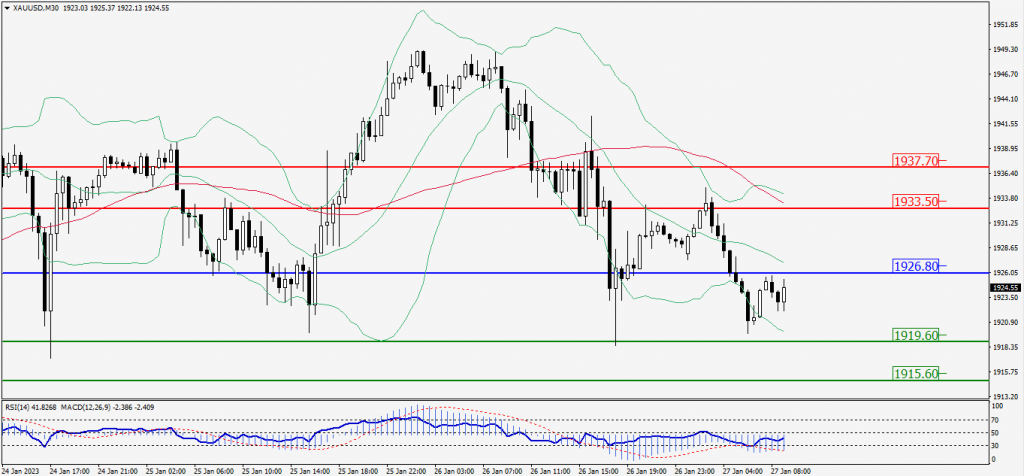
Green Lines Indicate Resistance Levels – Red Lines Indicate Support Levels
Light Blue is a Pivot Point – Black represents the price when the report was produced
Dow Jones Intraday: Trend on the upside
Our pivot point is 33,880.00
Preferable Price Action: Take buy positions up the pivot with targets at 34,064.00 & 34,162.00.
Alternative Price Action: Below 33,880.00 looks for further downside to 33,694.00 & 33,587.00.
Comment: RSI is above 50 levels and Pairs above 55MA.
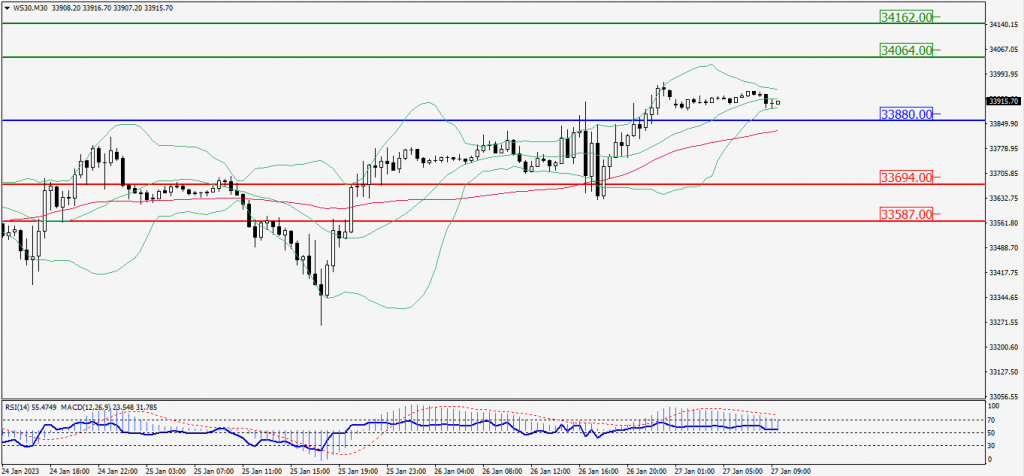
Green Lines Indicate Resistance Levels – Red Lines Indicate Support Levels
Light Blue is a Pivot Point – Black represents the price when the report was produced