Market Wrap: Stocks, Bonds, Commodities
US stocks ended firmly higher on Tuesday, led by a 1 percent gain in the Nasdaq, on relief that Federal Reserve Chair Jerome Powell refrained in a speech from commenting on rate policy.
The Dow Jones Industrial Average rose 186.45 points to 33,704.10, the S&P 500 gain 0.70% to 3,919.25 and the Nasdaq Composite add 106.98 points to 10,742.63.
MSCI’s index of Asia-Pacific stocks outside Japan is drop 0.17% to 659.08 levels. The Australian index was higher by 0.90% to 7,195.30. Japanese Nikkei Index gain 1.03% today.
European stocks were negative on Wednesday, with the Stoxx Europe 50 Index fell 0.27% to 4,057.46, Germany’s DAX lose 0.12% to 14,774.60, and France’s CAC decline 0.55% to 6,869.14, and U.K.’s FTSE 100 subtract 0.39% to 7,694.49.
Benchmark 10-year U.S. Treasury fell as demand for safe assets ascend again, today 10-year bond yields are negative 0.93% to 3.585.
Oil prices edged slightly higher on Tuesday as the US government forecast record global petroleum consumption next year and as the dollar hovered at seven-month lows.
Spot Brent crude oil fell 0.71% to $79.53 per barrel. US West Texas Intermediate crude is down 0.80% to $74.52 a barrel.
The yellow metal gold is advance 0.49% to 1,885.75 dollars per ounce.
Market Wrap: Forex
European stock markets are expected to open higher Wednesday, as investors gear up for the start in earnest of the region’s quarterly earnings season, with the retail sector in focus.
Today, the U.S. dollar index measures the Greenback against a trade-weighted basket of six major currencies, which slipped 0.03% to 102.948.
The Euro US Dollar (EUR/USD) is a widely traded pair that is up 0.11% today. This left the pair trading around $1.0745.
The Japanese yen was positive against the U.S. dollar on Wednesday. Today USD/JPY is ascend 0.03% to the 132.30 level.
Another commodity-related currency mixed against the U.S dollar, AUD/USD rose 0.28% to 0.6906, and NZD/USD lose 0.01% to 0.6371 level.
EUR/USD Intraday: Major trend on the upside
Our pivot point is at 1.07370
Preferable Price Action: Take long positions above pivot level with targets at 1.08400 & 1.09000 in extension.
Alternative Price Action: Below pivot looks for a further downside to 1.06410 & 1.05780.
Comment: RSI is above 50 levels and Pairs above its 20MA & 55MA.
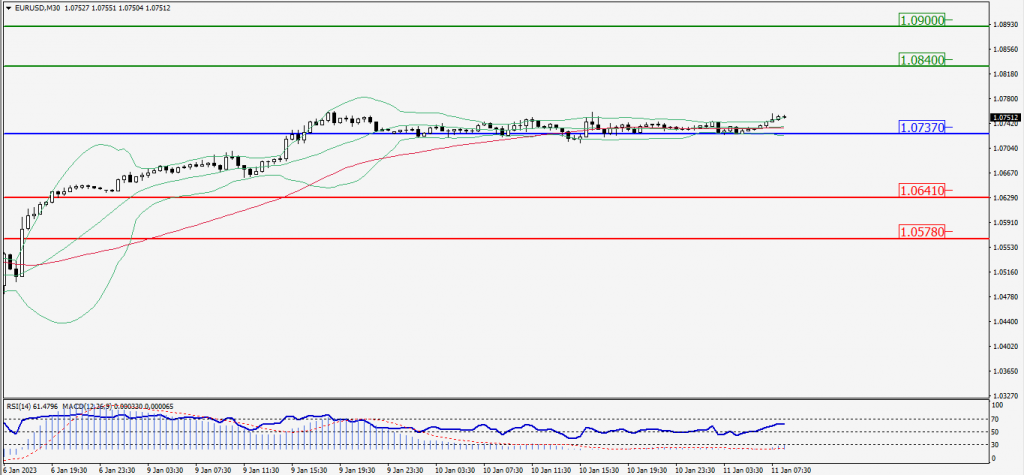
Green Lines Indicate Resistance Levels – Red Lines Indicate Support Levels
Light Blue is a Pivot Point – Black represents the price when the report was produced
GBP/USD Intraday: Support level at 1.21440
Our pivot point is at 1.21440
Preferable Price Action: Buy positions above pivot with targets at 1.22470 & 1.22990 in extension.
Alternative Price Action: The price below pivot would call for further downside to 1.20450 & 1.19910.
Comment: RSI is above 50 levels and Pairs above its 20MA & 55MA.
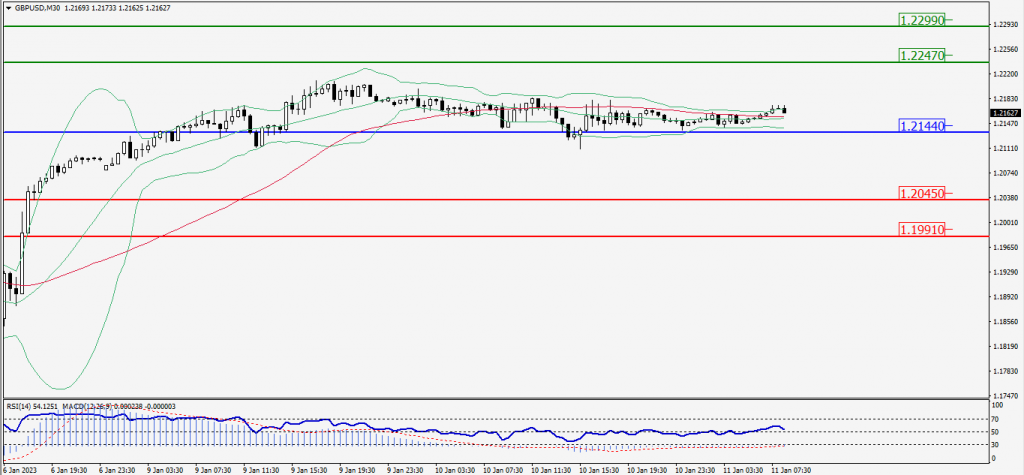
Green Lines Indicate Resistance Levels – Red Lines Indicate Support Levels
Light Blue is a Pivot Point – Black represents the price when the report was produced
USD/JPY Intraday: Trend on the upside
Our pivot point is at 132.220
Preferable Price Action: Buy position above pivot with the target at 133.060 and 133.530 in extension.
Alternative Price Action: The downside breakout of the pivot would call for 131.460 and 131.010.
Comment: MACD is positive territory and Pairs above 55MA.
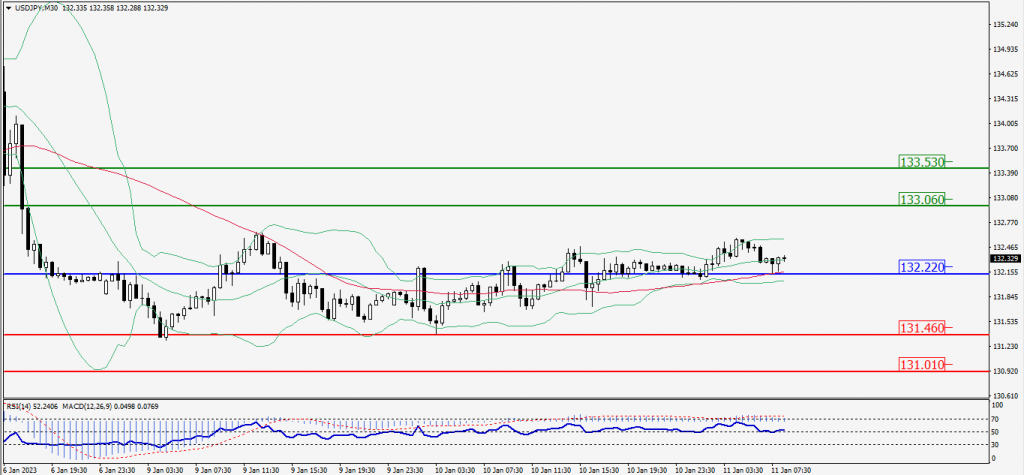
Green Lines Indicate Resistance Levels – Red Lines Indicate Support Levels
Light Blue is a Pivot Point – Black represents the price when the report was produced
AUD/USD Intraday: Support level at 0.69030
Our pivot point is at 0.69030
Preferable Price Action: Buy positions above pivot with targets at 0.69440 & 0.69700 in extension.
Alternative Price Action: Below pivot looks for a further downside with 0.68640 & 0.68380 as targets.
Comment: RSI is above 50 levels and pairs above its 20MA & 55MA.
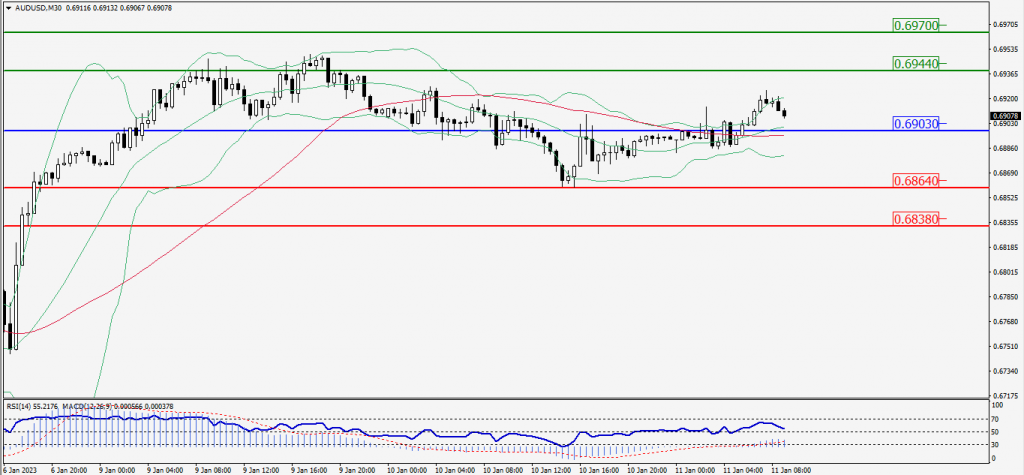
Green Lines Indicate Resistance Levels – Red Lines Indicate Support Levels
Light Blue is a Pivot Point – Black represents the price when the report was produced
CRUDEOIL Intraday: Trend on the downside
Our pivot point is at 74.92
Preferable Price Action: Below pivot sell oil with 74.29 & 73.86 as targets.
Alternative Price Action: Buy crude up pivot with targets at 75.59 and 75.99 in extension.
Comment: MACD is negative territory and Pairs below 55MA.
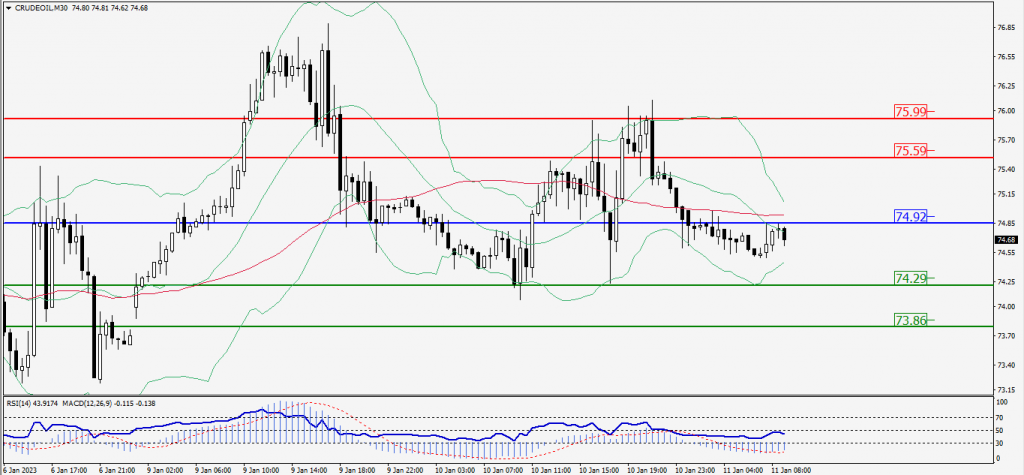
Green Lines Indicate Resistance Levels – Red Lines Indicate Support Levels
Light Blue is a Pivot Point – Black represents the price when the report was produced
XAU/USD Intraday: Trend on the upside
Our pivot point is 1877.90
Preferable Price Action: Further upside to 1895.70 and 1907.50
Alternative Price Action: If the price gives a downside breakout of a pivot, then the price extends to 1861.10 and 1849.40.
Comment: MACD is above 50 level and Pairs above its 20MA & 55MA.
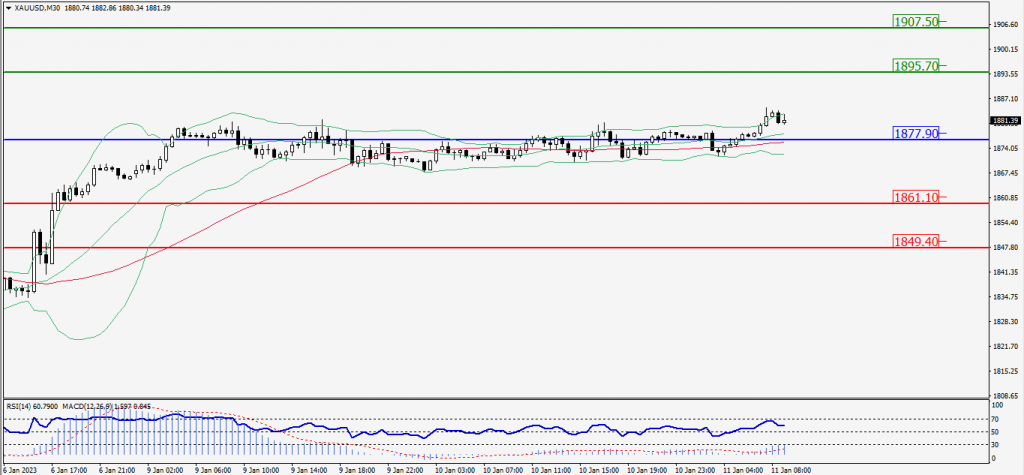
Green Lines Indicate Resistance Levels – Red Lines Indicate Support Levels
Light Blue is a Pivot Point – Black represents the price when the report was produced
Dow Jones Intraday: Trend on the upside
Our pivot point is 33,670.00
Preferable Price Action: Take buy positions up the pivot with targets at 33,831.00 & 33,936.00.
Alternative Price Action: Above 33,670.00 looks for further downside to 33,513.00 & 33,411.00.
Comment: RSI is above 50 levels and Pairs above 55MA.
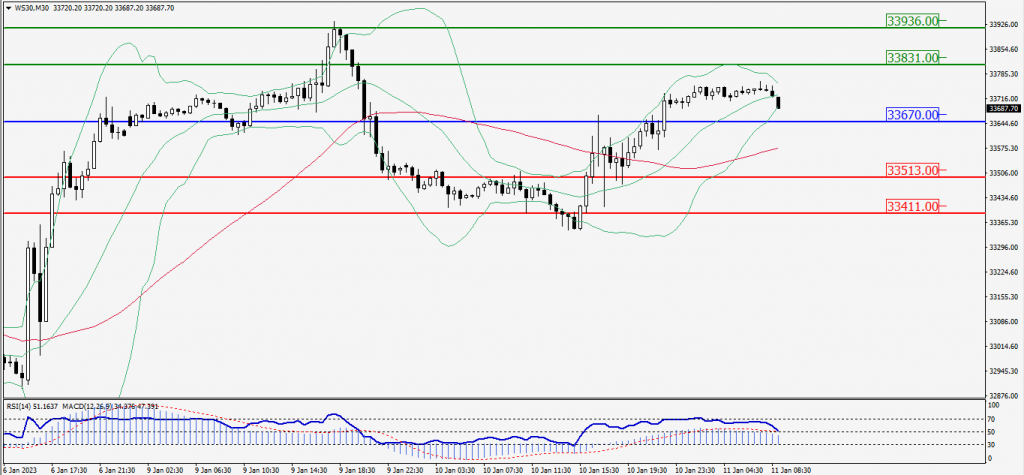
Green Lines Indicate Resistance Levels – Red Lines Indicate Support Levels
Light Blue is a Pivot Point – Black represents the price when the report was produced