Market Wrap: Stocks, Bonds, Commodities
US stocks ended up sharply on Wednesday, with the S&P 500 and Nasdaq gaining more than 1 percent each as investors were optimistic ahead of an inflation report that could give the Federal Reserve room to dial back on its aggressive interest rate hikes.
The Dow Jones Industrial Average rose 268.91 points to 33,973.01, the S&P 500 gain 1.28% to 3,969.61 and the Nasdaq Composite add 189.04 points to 10,931.67.
MSCI’s index of Asia-Pacific stocks outside Japan is drop 0.28% to 657.01 levels. The Australian index was higher by 1.18% to 7,280.40. Japanese Nikkei Index gain 0.01% today.
European stocks were positive on Thursday, with the Stoxx Europe 50 Index rose 1.04% to 4,099.76, Germany’s DAX gain 1.17% to 14,947.91, and France’s CAC advance 0.80% to 6,924.19, and U.K.’s FTSE 100 add 0.40% to 7,724.98.
Benchmark 10-year U.S. Treasury fell as demand for safe assets ascend again, today 10-year bond yields are negative 0.48% to 3.539.
Oil prices climbed 3 percent to a one-week high on Wednesday as hopes for an improved global economic outlook and concern over the impact of sanctions on Russian crude output outweighed a massive surprise build in US crude stocks.
Spot Brent crude oil rose 0.02% to $82.69 per barrel. US West Texas Intermediate crude is down 0.03% to $77.39 a barrel.
The yellow metal gold is advance 0.32% to 1,884.85 dollars per ounce.
Market Wrap: Forex
European stock markets are expected to open marginally higher Thursday, ahead of the release of key U.S. consumer price data as well as more quarterly earnings.
Today, the U.S. dollar index measures the Greenback against a trade-weighted basket of six major currencies, which surge 0.01% to 102.940.
The Euro US Dollar (EUR/USD) is a widely traded pair that is up 0.04% today. This left the pair trading around $1.0760.
The Japanese yen was negative against the U.S. dollar on Thursday. Today USD/JPY is ascend 0.52% to the 131.78 level.
Another commodity-related currency negative against the U.S dollar, AUD/USD fell 0.07% to 0.6894, and NZD/USD lose 0.22% to 0.6348 level.
EUR/USD Intraday: In a consolidation zone
Our pivot point is at 1.07580
Preferable Price Action: Take long positions above pivot level with targets at 1.07850 & 1.08010 in extension.
Alternative Price Action: Below pivot looks for a further downside to 1.07340 & 1.07190.
Comment: RSI is at 50 levels and Pairs above 55MA.
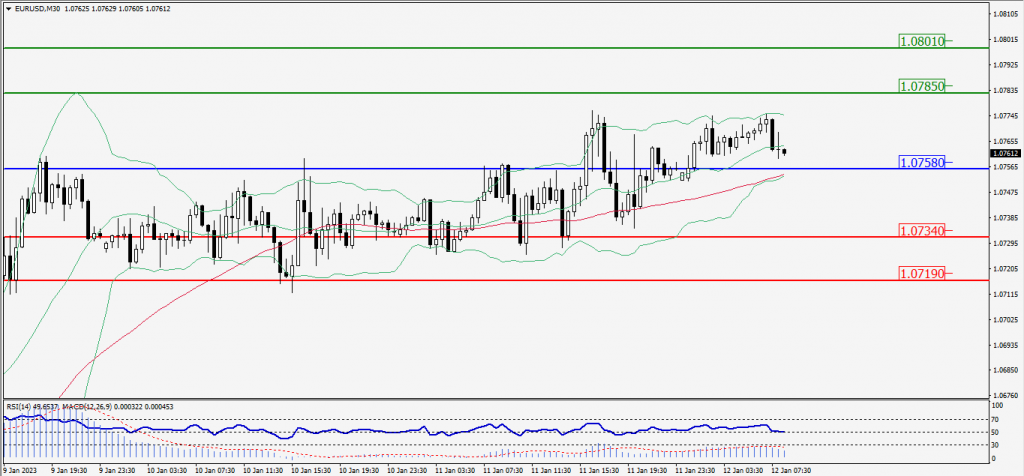
Green Lines Indicate Resistance Levels – Red Lines Indicate Support Levels
Light Blue is a Pivot Point – Black represents the price when the report was produced
GBP/USD Intraday: Resistance level at 1.21540
Our pivot point is at 1.21540
Preferable Price Action: Sell positions below pivot with targets at 1.21280 & 1.21120 in extension.
Alternative Price Action: The price above pivot would call for further upside to 1.21810 & 1.21980.
Comment: RSI is below 50 levels and Pairs below 20MA.
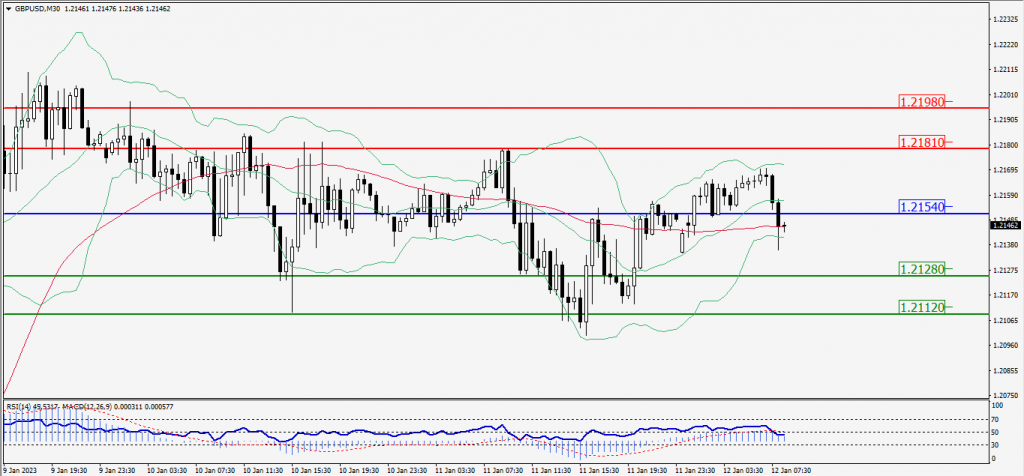
Green Lines Indicate Resistance Levels – Red Lines Indicate Support Levels
Light Blue is a Pivot Point – Black represents the price when the report was produced
USD/JPY Intraday: Trend on the downside
Our pivot point is at 131.860
Preferable Price Action: Sell position below pivot with the target at 131.380 and 131.040 in extension.
Alternative Price Action: The upside breakout of the pivot would call for 132.360 and 132.680.
Comment: MACD is negative territory and Pairs below its 20MA & 55MA.
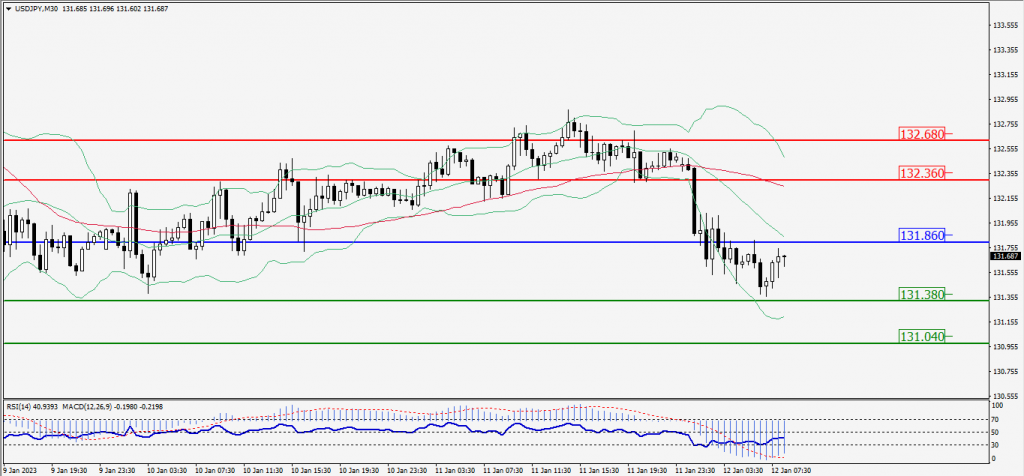
Green Lines Indicate Resistance Levels – Red Lines Indicate Support Levels
Light Blue is a Pivot Point – Black represents the price when the report was produced
AUD/USD Intraday: Resistance level at 0.69070
Our pivot point is at 0.69070
Preferable Price Action: Sell positions below pivot with targets at 0.68900 & 0.68780 in extension.
Alternative Price Action: Above pivot looks for a further upside with 0.69240 & 0.69360 as targets.
Comment: RSI is below 50 levels and pairs below 20MA.
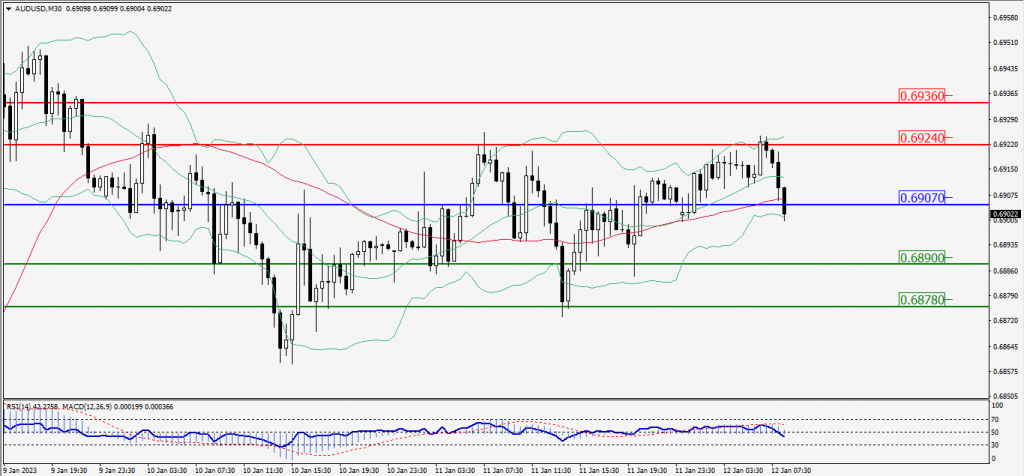
Green Lines Indicate Resistance Levels – Red Lines Indicate Support Levels
Light Blue is a Pivot Point – Black represents the price when the report was produced
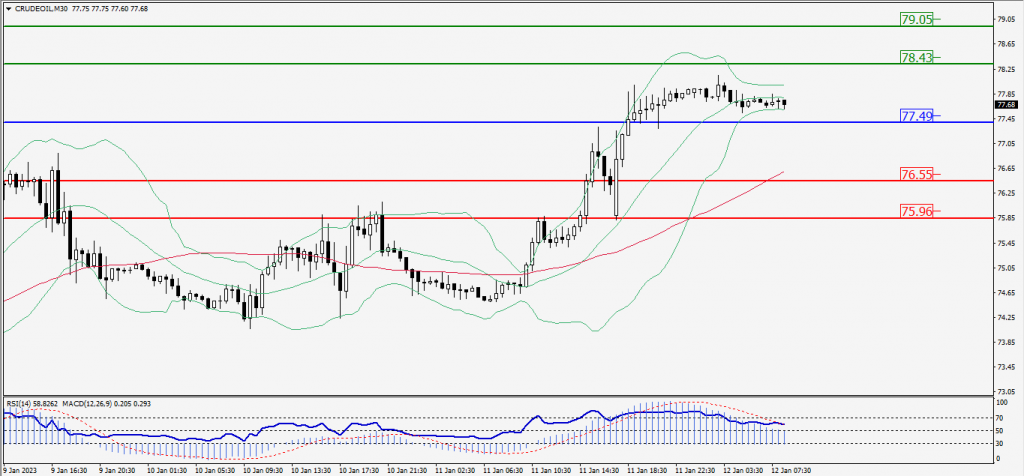
CRUDEOIL Intraday: Trend on the upside
Our pivot point is at 77.49
Preferable Price Action: Above pivot buy oil with 78.43 & 79.05 as targets.
Alternative Price Action: Sell crude down pivot with targets at 76.55 and 75.96 in extension.
Comment: MACD is positive territory and Pairs above 55MA.
Green Lines Indicate Resistance Levels – Red Lines Indicate Support Levels
Light Blue is a Pivot Point – Black represents the price when the report was produced
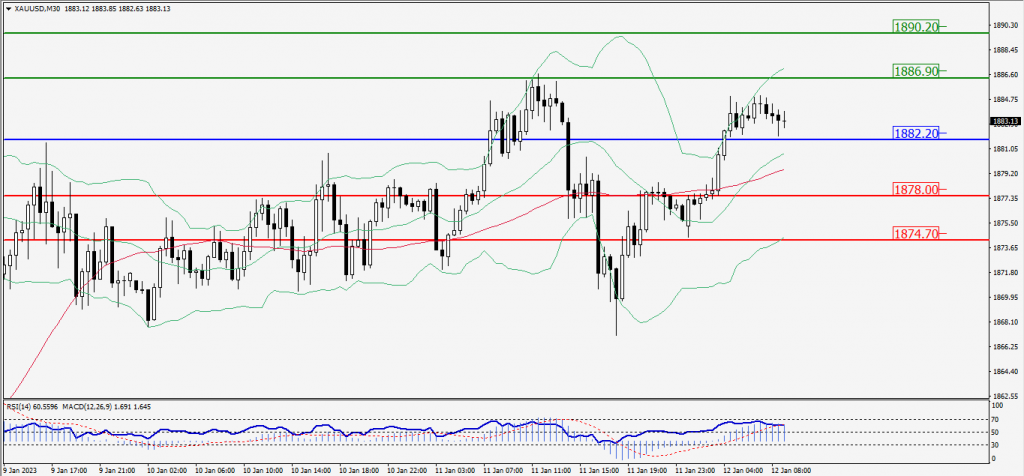
XAU/USD Intraday: Major trend on the upside
Our pivot point is 1882.20
Preferable Price Action: Further upside to 1886.90 and 1890.20
Alternative Price Action: If the price gives a downside breakout of a pivot, then the price extends to 1878.00 and 1874.70.
Comment: MACD is above 50 level and Pairs above its 20MA & 55MA.
Green Lines Indicate Resistance Levels – Red Lines Indicate Support Levels
Light Blue is a Pivot Point – Black represents the price when the report was produced
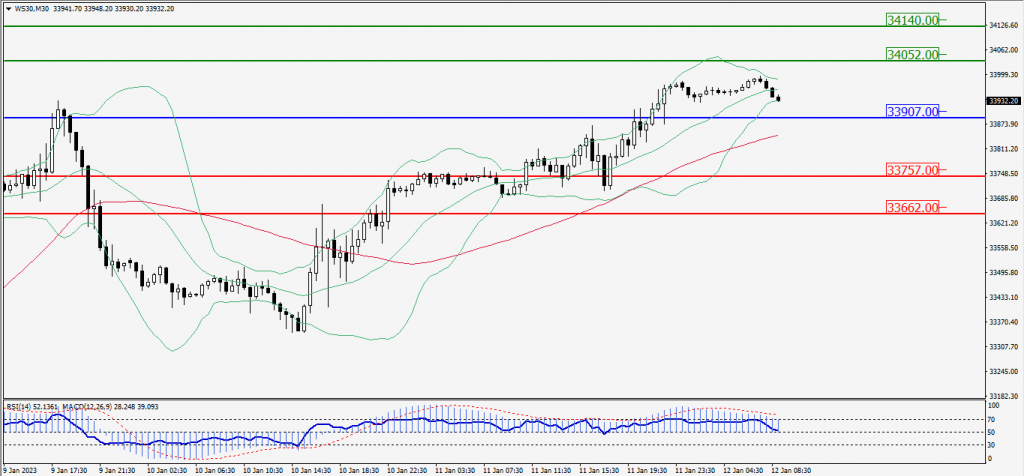
Dow Jones Intraday: Trend on the upside
Our pivot point is 33,907.00
Preferable Price Action: Take buy positions up the pivot with targets at 34,052.00 & 34,140.00.
Alternative Price Action: Above 33,907.00 looks for further downside to 33,757.00 & 33,662.00.
Comment: RSI is above 50 levels and Pairs above 55MA.
Green Lines Indicate Resistance Levels – Red Lines Indicate Support Levels
Light Blue is a Pivot Point – Black represents the price when the report was produced