Market Wrap: Stocks, Bonds, Commodities
The S&P 500 index erased early gains to close nearly flat on Monday as expectations that the Federal Reserve will become less aggressive with its interest rate hikes were offset by lingering worries about inflation. The Dow ended lower, and the Nasdaq Composite ended well off the day’s highs.
The Dow Jones Industrial Average fell 112.96 points to 33,517.65, the S&P 500 lose 0.08% to 3,892.09 and the Nasdaq Composite add 66.36 points to 10,635.65.
MSCI’s index of Asia-Pacific stocks outside Japan is drop 0.41% to 656.06 levels. The Australian index was lower by 0.28% to 7,131.00. Japanese Nikkei Index gain 0.78% today.
European stocks were negative on Tuesday, with the Stoxx Europe 50 Index fell 0.57% to 4,045.55, Germany’s DAX lose 0.42% to 14,731.35, and France’s CAC decline 0.72% to 6,857.81, and U.K.’s FTSE 100 subtract 0.40% to 7,692.80.
Benchmark 10-year U.S. Treasury fell as demand for safe assets ascend again, today 10-year bond yields are positive 0.69% to 3.541.
Oil prices were little changed on Tuesday, giving up some of the gains from the previous session, as traders awaited clarity on the Federal Reserve’s plans for rate hikes to gauge the impact on the economy and fuel demand.
Spot Brent crude oil fell 0.45% to $79.29 per barrel. US West Texas Intermediate crude is down 0.43% to $74.31 a barrel.
The yellow metal gold is advance 0.07% to 1,876.55 dollars per ounce.
Market Wrap: Forex
The U.S. dollar was steady on Monday as investors digested a clutch of economic data released last week that stoked hopes of the Federal Reserve slowing the pace of its interest rate hikes.
Today, the U.S. dollar index measures the Greenback against a trade-weighted basket of six major currencies, which surge 0.27% to 103.023.
The Euro US Dollar (EUR/USD) is a widely traded pair that is up 0.02% today. This left the pair trading around $1.0730.
The Japanese yen was positive against the U.S. dollar on Tuesday. Today USD/JPY is ascend 0.19% to the 132.13 level.
Another commodity-related currency mixed against the U.S dollar, AUD/USD fell 0.24% to 0.6895, and NZD/USD gain 0.02% to 0.6369 level.
EUR/USD Intraday: In a consolidation zone
Our pivot point is at 1.07220
Preferable Price Action: Take long positions above pivot level with targets at 1.07830 & 1.08260 in extension.
Alternative Price Action: Below pivot looks for a further downside to 1.06620 & 1.06170.
Comment: RSI is at 50 levels and Pairs above 55MA.
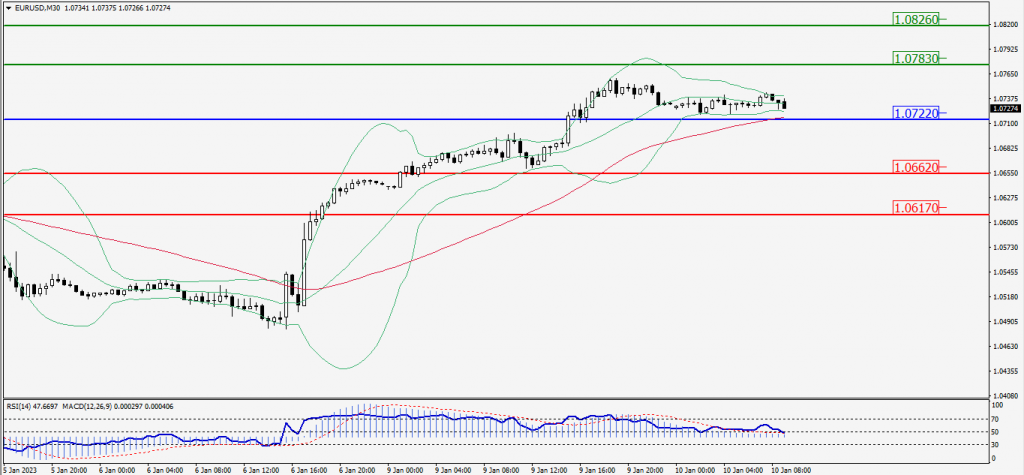
Green Lines Indicate Resistance Levels – Red Lines Indicate Support Levels
Light Blue is a Pivot Point – Black represents the price when the report was produced
GBP/USD Intraday: Resistance level at 1.21960
Our pivot point is at 1.21960
Preferable Price Action: Sell positions below pivot with targets at 1.20950 & 1.20250 in extension.
Alternative Price Action: The price above pivot would call for further upside to 1.23040 & 1.23730.
Comment: RSI is below 50 levels and Pairs below 20MA.
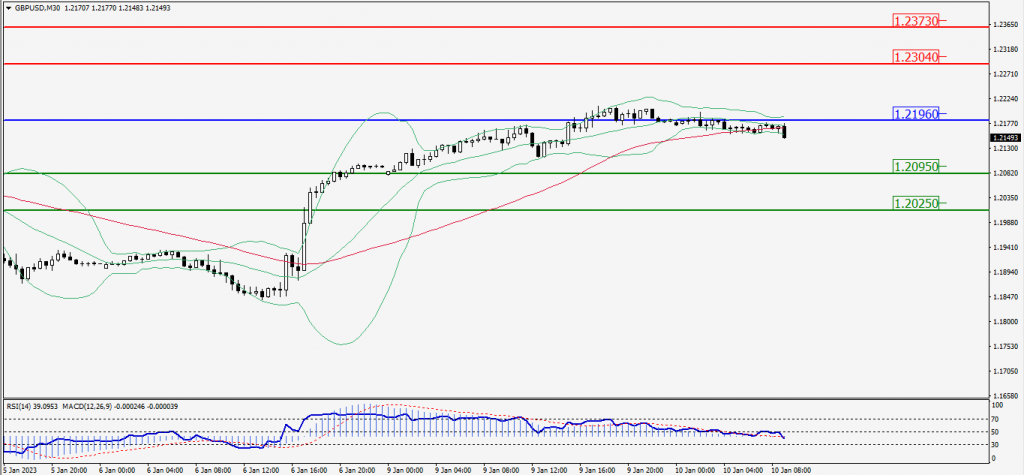
Green Lines Indicate Resistance Levels – Red Lines Indicate Support Levels
Light Blue is a Pivot Point – Black represents the price when the report was produced
USD/JPY Intraday: Support level at 131.840
Our pivot point is at 131.840
Preferable Price Action: Buy position above pivot with the target at 133.180 and 134.080 in extension.
Alternative Price Action: The downside breakout of the pivot would call for 130.620 and 129.700.
Comment: MACD is positive territory and Pairs above 20MA.
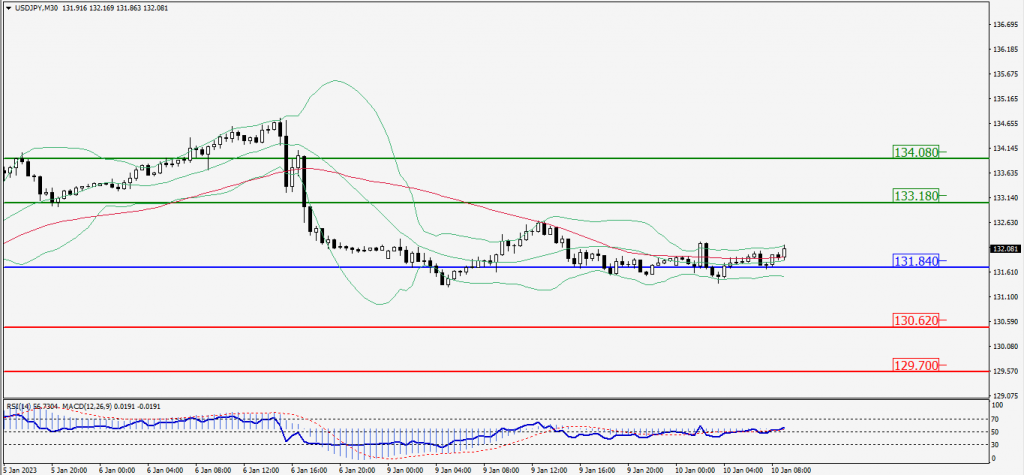
Green Lines Indicate Resistance Levels – Red Lines Indicate Support Levels
Light Blue is a Pivot Point – Black represents the price when the report was produced
AUD/USD Intraday: Resistance level at 0.69300
Our pivot point is at 0.69300
Preferable Price Action: Sell Positions below pivot with targets at 0.68710 & 0.68260 in extension.
Alternative Price Action: Above pivot looks for a further upside with 0.69890 & 0.70340 as targets.
Comment: RSI is below 50 levels and pairs below 55MA.
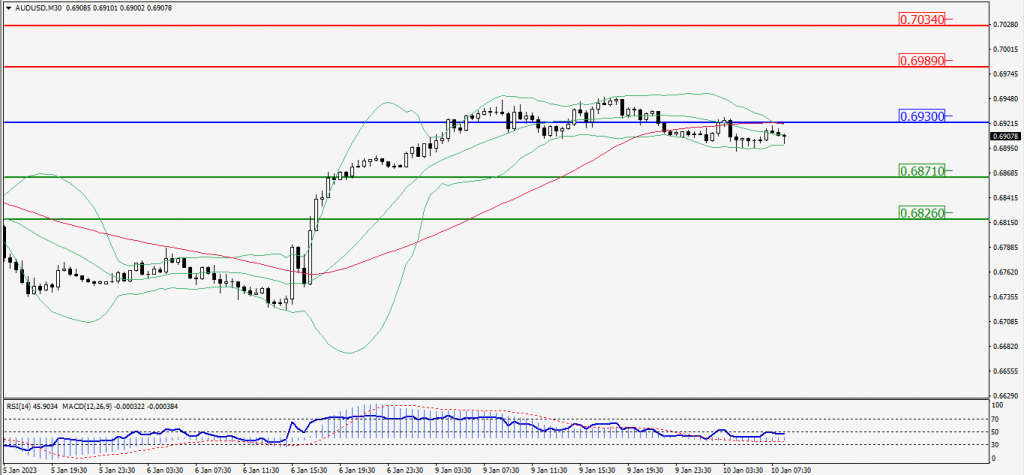
Green Lines Indicate Resistance Levels – Red Lines Indicate Support Levels
Light Blue is a Pivot Point – Black represents the price when the report was produced
CRUDEOIL Intraday: Trend on the downside
Our pivot point is at 74.92
Preferable Price Action: Below pivot sell oil with 74.17 & 73.64 as targets.
Alternative Price Action: Buy crude up pivot with targets at 75.69 and 76.25 in extension.
Comment: MACD is negative territory and Pairs below 55MA.
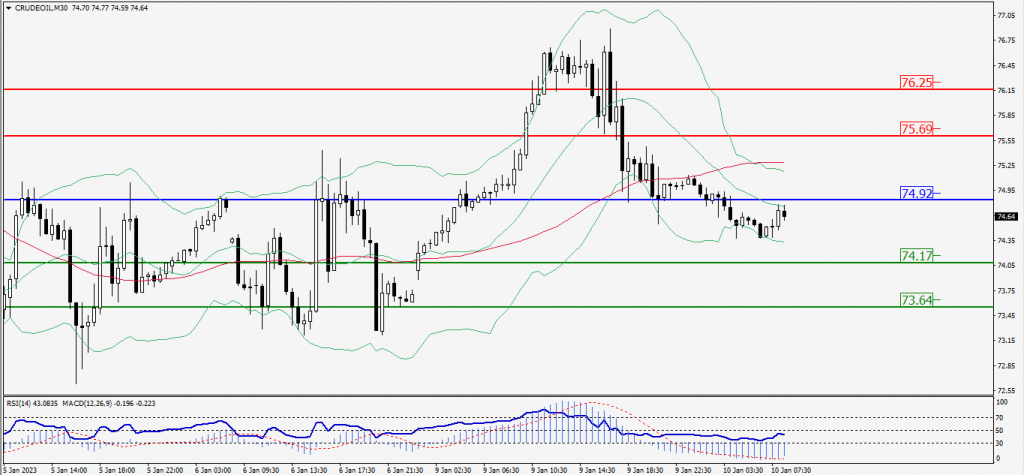
Green Lines Indicate Resistance Levels – Red Lines Indicate Support Levels
Light Blue is a Pivot Point – Black represents the price when the report was produced
XAU/USD Intraday: Trend on the upside
Our pivot point is 1870.60
Preferable Price Action: Further upside to 1883.30 and 1892.20
Alternative Price Action: If the price gives a downside breakout of a pivot, then the price extends to 1858.40 and 1850.10.
Comment: MACD is above 50 level and Pairs above 20MA.
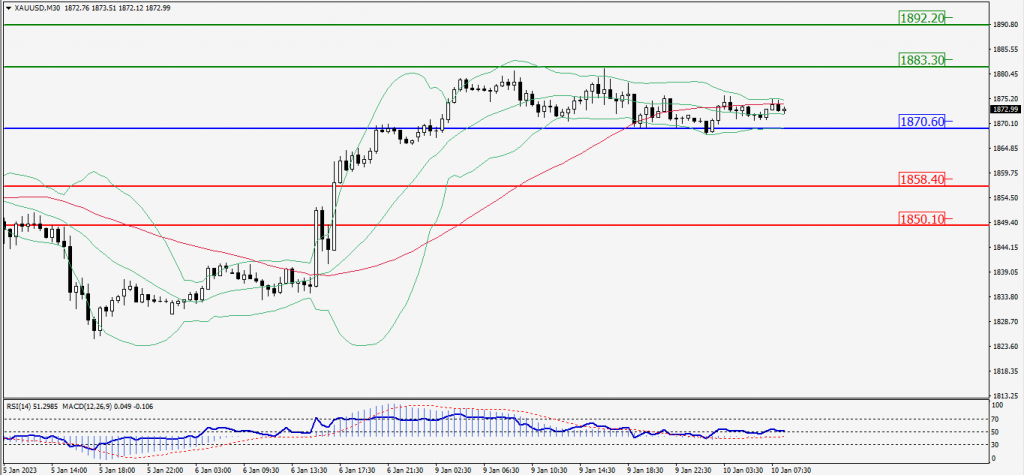
Green Lines Indicate Resistance Levels – Red Lines Indicate Support Levels
Light Blue is a Pivot Point – Black represents the price when the report was produced
Dow Jones Intraday: Trend on the downside
Our pivot point is 33,524.00
Preferable Price Action: Take sell positions down the pivot with targets at 33,335.00 & 33,178.00.
Alternative Price Action: Above 33,524.00 looks for further upside to 33,722.00 & 33,874.00.
Comment: RSI is below 50 levels and Pairs below 55MA.
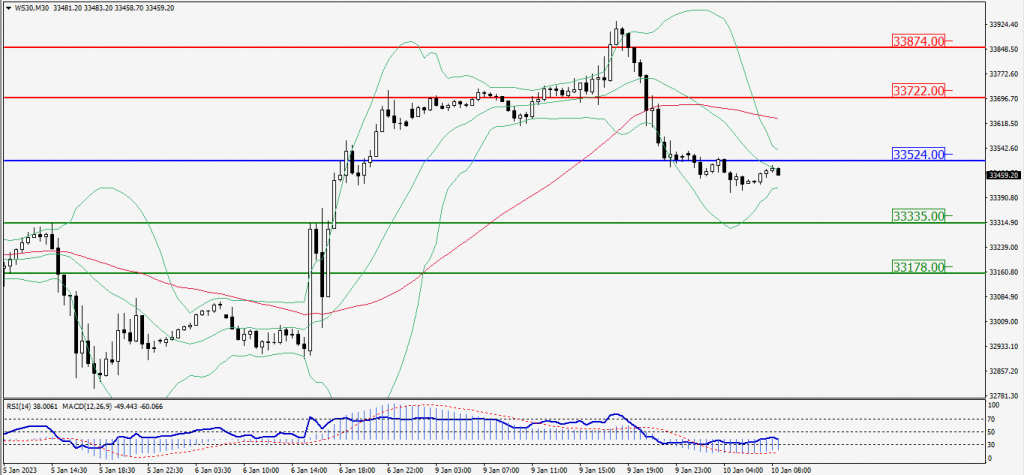
Green Lines Indicate Resistance Levels – Red Lines Indicate Support Levels
Light Blue is a Pivot Point – Black represents the price when the report was produced