Market Wrap: Stocks, Bonds, Commodities
The S&P 500 closed slightly lower on Friday, although major indexes rallied off their worst levels of the day, as the November payrolls report fueled expectations the Federal Reserve would maintain its path of interest rate hikes to combat inflation.
The Dow Jones Industrial Average rose 34.87 points to 34,429.88, the S&P 500 lose 0.12% to 4,071.70 and the Nasdaq Composite subtract 20.95 points to 11,461.50.
MSCI’s index of Asia-Pacific stocks outside Japan is ascend 1.82% to 686.77 levels. The Australian index was higher by 0.33% to 7,325.60. Japanese Nikkei Index gain 0.15% today.
European stocks were negative on Monday, with the Stoxx Europe 50 Index fell 0.17% to 3,971.15, Germany’s DAX lose 0.28% to 14,486.95, and France’s CAC decline 0.21% to 6,727.40, and U.K.’s FTSE 100 add 0.09% to 7,564.36.
Benchmark 10-year U.S. Treasury fell as demand for safe assets ascend again, today 10-year bond yields are positive 0.97% to 3.537.
Oil prices inched up in early trade after OPEC+ nations reaffirmed their oil output targets ahead of a European Union ban and price caps on Russian crude, which kick off on Monday.
Spot Brent crude oil rose 1.20% to $86.60 per barrel. US West Texas Intermediate crude is up 1.20% to $80.94 a barrel.
The yellow metal gold is advance 0.07% to 1,810.90 dollars per ounce.
Market Wrap: Forex
The U.S. dollar weakened in early European trade Monday and the Chinese yuan soared to its highest level since mid-September as relaxation of some of China’s strict COVID-19 curbs boosted risk appetite.
Today, the U.S. dollar index measures the Greenback against a trade-weighted basket of six major currencies, which surged 0.01% to 104.510.
The Euro US Dollar (EUR/USD) is a widely traded pair that is up 0.10% today. This left the pair trading around $1.05490.
The Japanese yen was negative against the U.S. dollar on Monday. Today USD/JPY is ascend 0.80% to the 135.380 level.
Another commodity-related currency mixed against the U.S dollar, AUD/USD rose 0.19% to 0.68020, and NZD/USD lose 0.10% to 0.64020 level.
EUR/USD Intraday: Trend on the downside
Our pivot point is at 1.05690
Preferable Price Action: Take short positions below pivot level with targets at 1.04960 & 1.04480 in extension.
Alternative Price Action: Above pivot looks for a further upside to 1.06370 & 1.06870.
Comment: RSI below 50 levels and Pairs below 20MA.
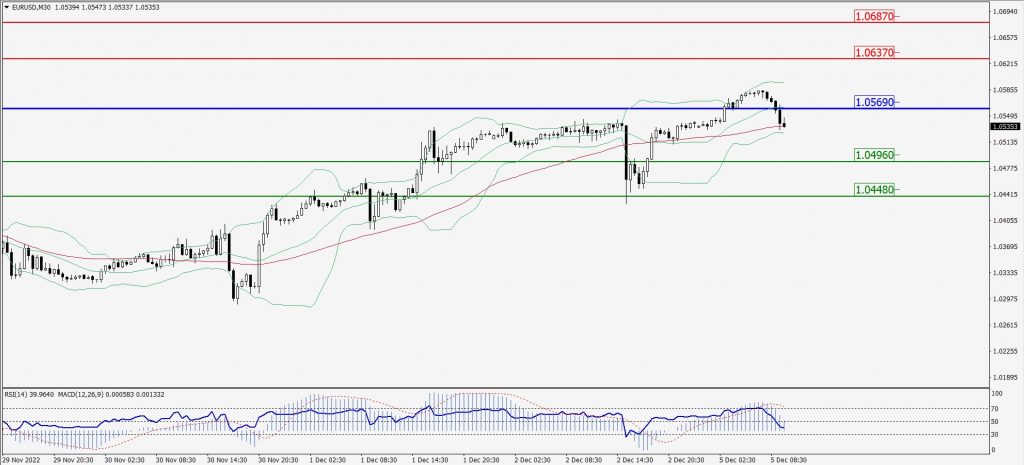
Green Lines Indicate Resistance Levels – Red Lines Indicate Support Levels
Light Blue is a Pivot Point – Black represents the price when the report was produced
GBP/USD Intraday: Trend on the downside
Our pivot point is at 1.23200
Preferable Price Action: Sell positions below pivot with targets at 1.22140 & 1.21440 in extension.
Alternative Price Action: The price above pivot would call for further upside to 1.24100 & 1.24790.
Comment: RSI below 50 levels and Pairs below 20MA.
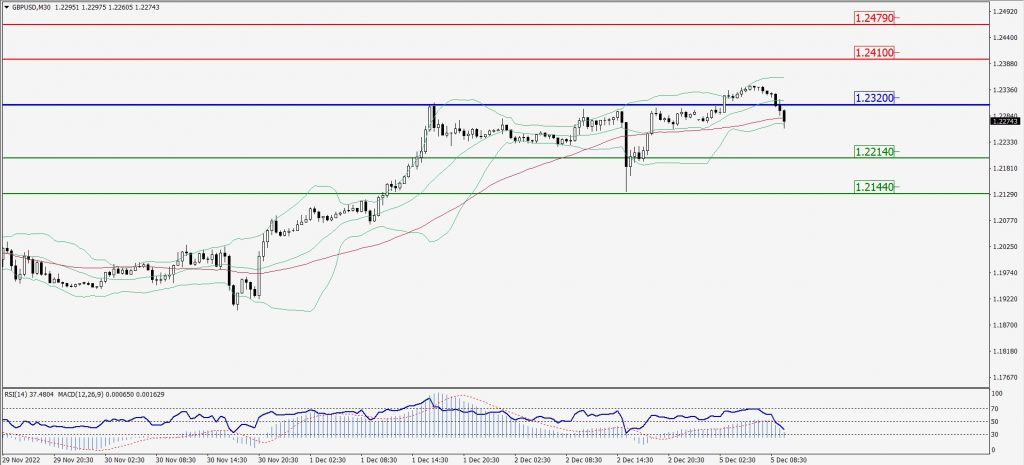
Green Lines Indicate Resistance Levels – Red Lines Indicate Support Levels
Light Blue is a Pivot Point – Black represents the price when the report was produced
USD/JPY Intraday: Trend on the upside
Our pivot point is at 134.800
Preferable Price Action: Buy position above pivot with the target at 136.040 and 136.980 in extension.
Alternative Price Action: The upside breakout of the pivot would call for 133.650 and 132.660.
Comment: MACD is positive territory and Pairs above its 20MA & 55MA.
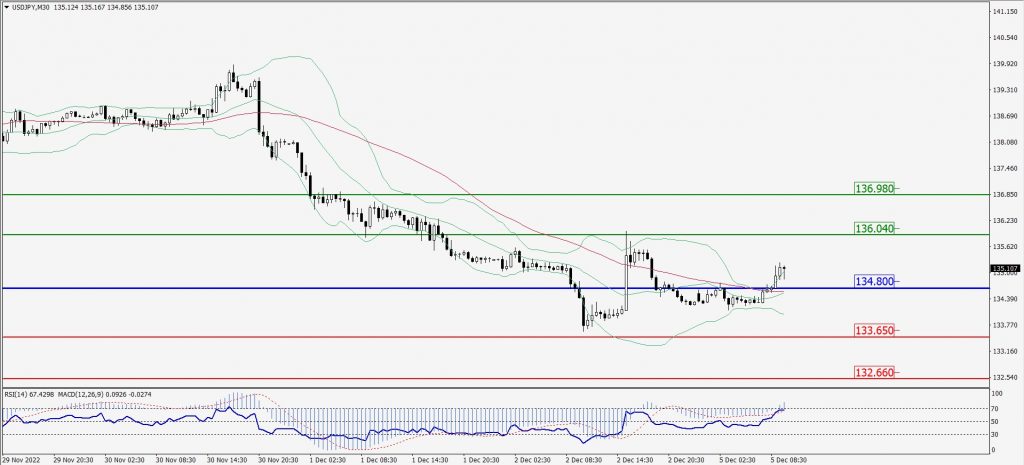
Green Lines Indicate Resistance Levels – Red Lines Indicate Support Levels
Light Blue is a Pivot Point – Black represents the price when the report was produced
AUD/USD Intraday: Resistance level at 0.68260
Our pivot point is at 0.68260
Preferable Price Action: Sell Positions below pivot with targets at 0.67780 & 0.67460 in extension.
Alternative Price Action: Above pivot looks for a further upside with 0.68660 & 0.68970 as targets.
Comment: RSI below 50 levels and Pairs below its 20MA & 55MA.

Green Lines Indicate Resistance Levels – Red Lines Indicate Support Levels
Light Blue is a Pivot Point – Black represents the price when the report was produced
CRUDEOIL Intraday: Trend on the downside
Our pivot point is at 81.22
Preferable Price Action: Below pivots sell oil with 79.81 & 78.77 as targets.
Alternative Price Action: Buy crude above pivot with targets at 82.59 and 83.75 in extension.
Comment: MACD is in the negative territory and Pairs below its 20MA & 55MA.
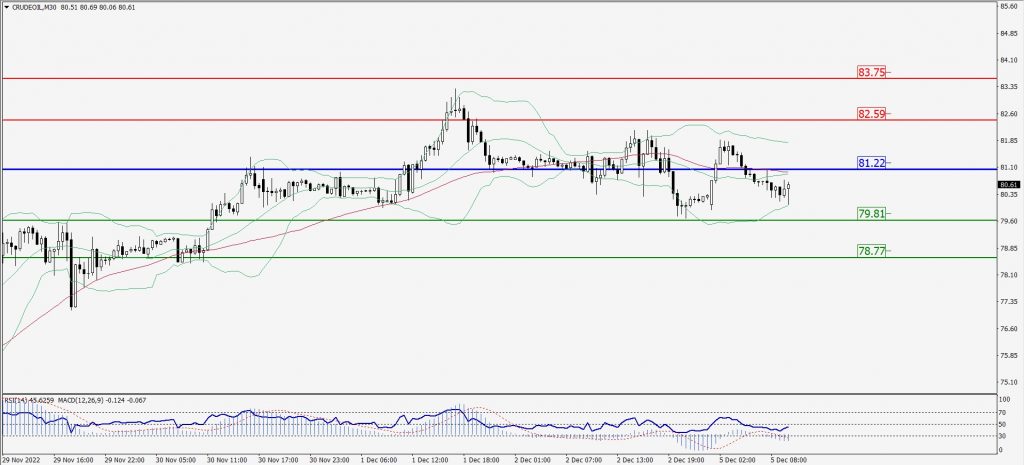
Green Lines Indicate Resistance Levels – Red Lines Indicate Support Levels
Light Blue is a Pivot Point – Black represents the price when the report was produced
XAU/USD Intraday: Major trend on the downside
Our pivot point is 1805.60
Preferable Price Action: Further downside to 1792.10 and 1783.10
Alternative Price Action: If the price gives an upside breakout of a pivot, then the price extends to 1815.00 and 1824.10.
Comment: MACD is negative territory and Pairs below its 20MA & 55MA.
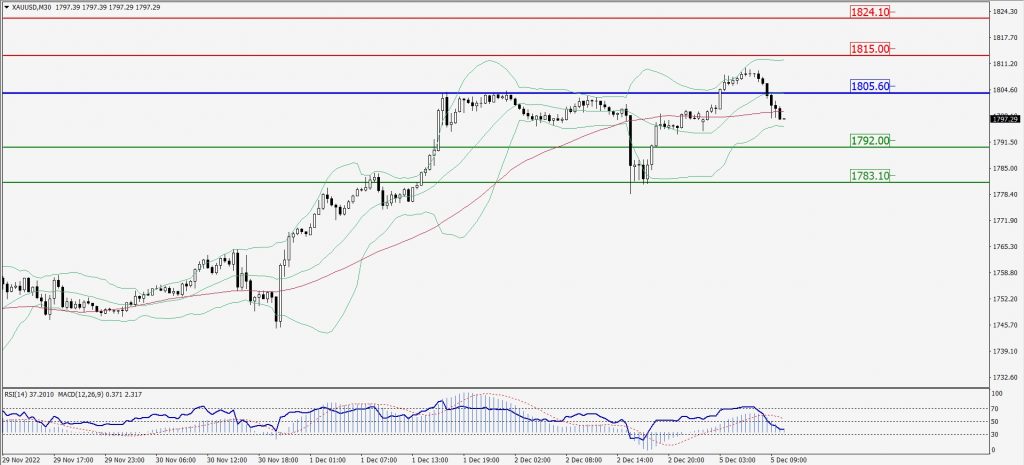
Green Lines Indicate Resistance Levels – Red Lines Indicate Support Levels
Light Blue is a Pivot Point – Black represents the price when the report was produced
Dow Jones Intraday: Resistance level at 34,430.00
Our pivot point is 34,430.00
Preferable Price Action: Take sell positions below the pivot with targets at 34,253.00 & 34,115.00.
Alternative Price Action: Above 34,430.00 looks for further upside to 34,604.00 & 34,750.00.
Comment: RSI below 50 levels and Pairs below its 20MA & 55MA.
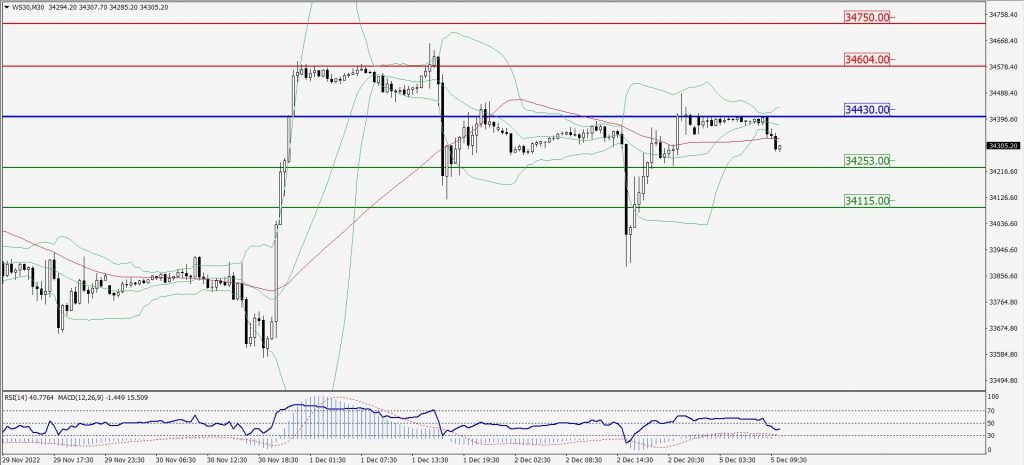
Green Lines Indicate Resistance Levels – Red Lines Indicate Support Levels
Light Blue is a Pivot Point – Black represents the price when the report was produced