Market Wrap: Stocks, Bonds, Commodities
Wall Street ended mixed on Thursday as a selloff in Salesforce weighed on the Dow, while traders digested US data that suggested the Federal Reserve’s interest rate hikes are working.
The Dow Jones Industrial Average fell 194.76 points to 34,395.01, the S&P 500 lose 0.09% to 4,076.57 and the Nasdaq Composite add 14.45 points to 11,482.45.
MSCI’s index of Asia-Pacific stocks outside Japan is drop 0.55% to 625.16 levels. The Australian index was lower by 0.72% to 7,301.50. Japanese Nikkei Index lose 1.59% today.
European stocks were negative on Friday, with the Stoxx Europe 50 Index fell 0.31% to 3,971.15, Germany’s DAX lose 0.19% to 14,460.45, and France’s CAC decline 0.43% to 6,723.03, and U.K.’s FTSE 100 subtract 0.38% to 7,528.60.
Benchmark 10-year U.S. Treasury fell as demand for safe assets ascend again, today 10-year bond yields are positive 0.18% to 3.533.
Oil prices settled largely narrowly mixed on Thursday, retreating from an early rally built on dollar weakness and hopes for improved fuel demand in China after COVID-19 curbs were eased in two major Chinese cities.
Spot Brent crude oil rose 0.24% to $87.08 per barrel. US West Texas Intermediate crude is down 0.04% to $81.20 a barrel.
The yellow metal gold is decline 0.08% to 1,813.95 dollars per ounce.
Market Wrap: Forex
Most Asian currencies moved little on Friday as caution kicked in ahead of U.S. payrolls data that is likely to affect monetary policy, although dovish signals from the Federal Reserve pushed the dollar to a three-month low.
Today, the U.S. dollar index measures the Greenback against a trade-weighted basket of six major currencies, which slipped 0.02% to 104.680.
The Euro US Dollar (EUR/USD) is a widely traded pair that is up 0.08% today. This left the pair trading around $1.05160.
The Japanese yen was negative against the U.S. dollar on Friday. Today USD/JPY is drop 0.37% to the 134.760 level.
Another commodity-related currency positive against the U.S dollar, AUD/USD rose 0.04% to 0.68110, and NZD/USD gain 0.31% to 0.63880 level.
EUR/USD Intraday: Trend on the upside
Our pivot point is at 1.05170
Preferable Price Action: Take long positions above pivot level with targets at 1.05730 & 1.06110 in extension.
Alternative Price Action: Below pivot looks for a further downside to 1.04670 & 1.04310.
Comment: RSI above 50 levels and Pairs above its 20MA & 55MA.
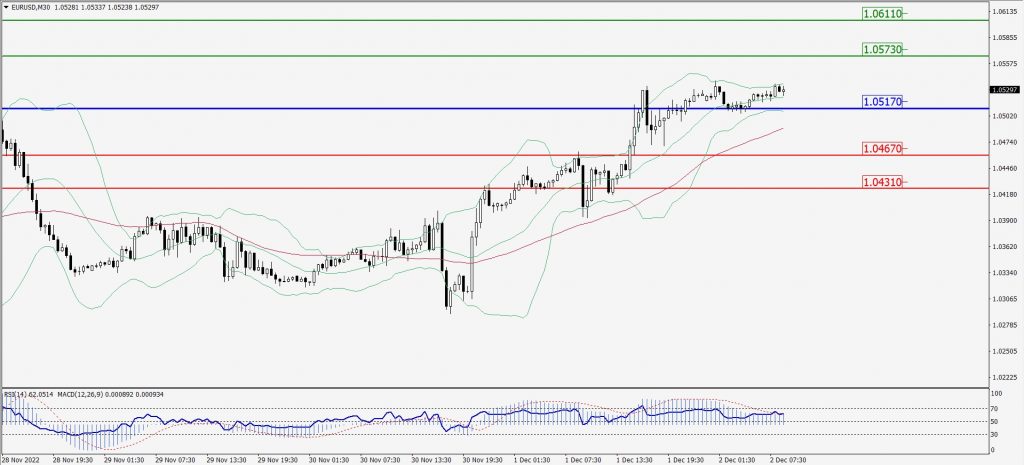
Green Lines Indicate Resistance Levels – Red Lines Indicate Support Levels
Light Blue is a Pivot Point – Black represents the price when the report was produced
GBP/USD Intraday: In a consolidation zone
Our pivot point is at 1.22650
Preferable Price Action: Sell positions below pivot with targets at 1.21940 & 1.21390 in extension.
Alternative Price Action: The price above pivot would call for further upside to 1.23270 & 1.23780.
Comment: RSI at 50 levels and Pairs below 20MA.
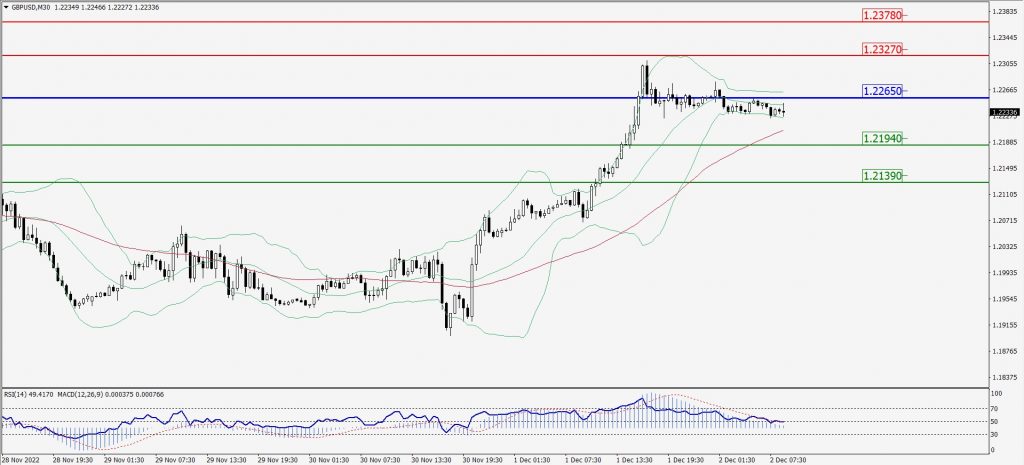
Green Lines Indicate Resistance Levels – Red Lines Indicate Support Levels
Light Blue is a Pivot Point – Black represents the price when the report was produced
USD/JPY Intraday: Major trend on the downside
Our pivot point is at 135.430
Preferable Price Action: Sell position below pivot with the target at 134.010 and 133.110 in extension.
Alternative Price Action: The upside breakout of the pivot would call for 136.500 and 137.510.
Comment: MACD is negative territory and Pairs below its 20MA & 55MA.
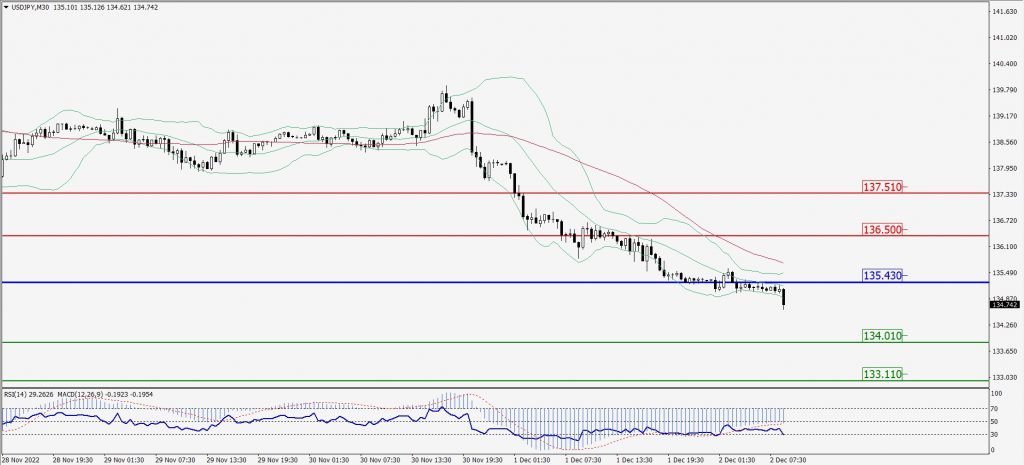
Green Lines Indicate Resistance Levels – Red Lines Indicate Support Levels
Light Blue is a Pivot Point – Black represents the price when the report was produced
AUD/USD Intraday: Major trend on the upside
Our pivot point is at 0.68050
Preferable Price Action: Buy Positions above pivot with targets at 0.68560 & 0.68950 in extension.
Alternative Price Action: Below pivot looks for a further downside with 0.67600 & 0.67260 as targets.
Comment: RSI above 50 levels and Pairs above its 20MA & 55MA.
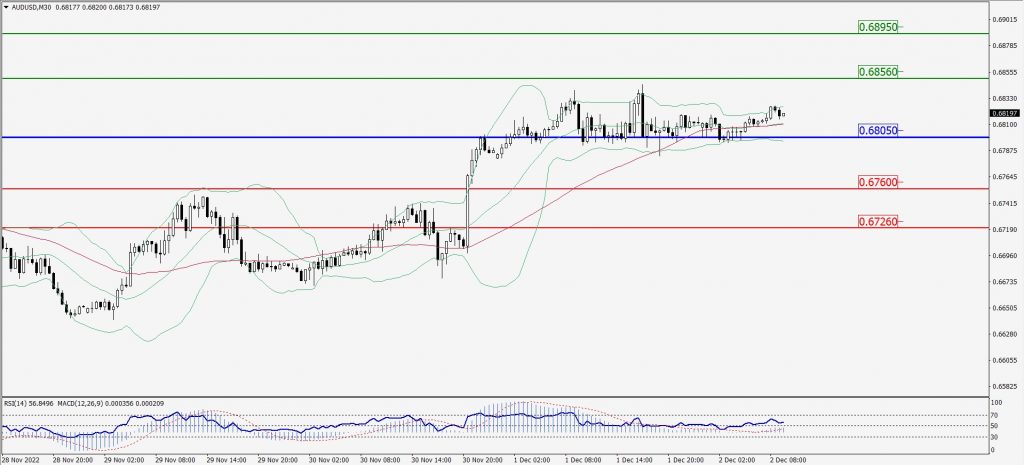
Green Lines Indicate Resistance Levels – Red Lines Indicate Support Levels
Light Blue is a Pivot Point – Black represents the price when the report was produced
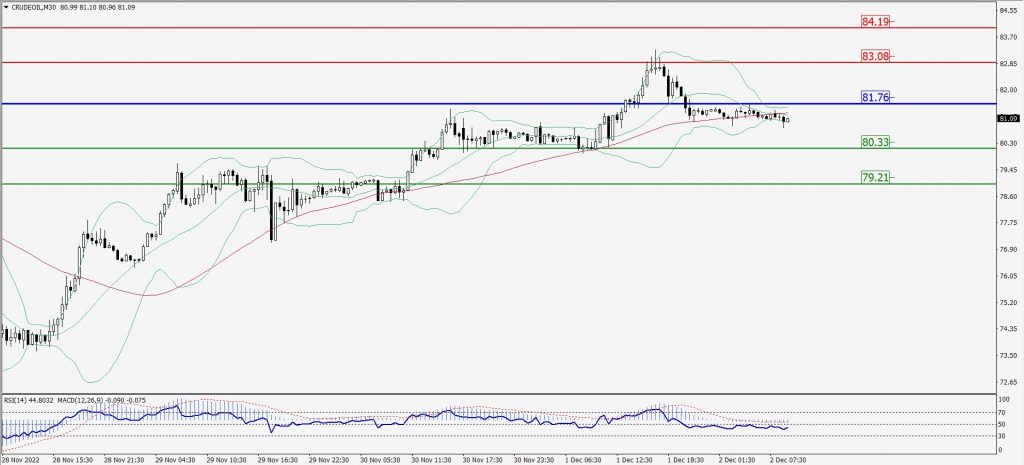
CRUDEOIL Intraday: Resistance level at 81.76
Our pivot point is at 81.76
Preferable Price Action: Below pivots sell oil with 80.33 & 79.21 as targets.
Alternative Price Action: Buy crude above pivot with targets at 83.08 and 84.19 in extension.
Comment: MACD is in the negative territory and Pairs below 55MA.
Green Lines Indicate Resistance Levels – Red Lines Indicate Support Levels
Light Blue is a Pivot Point – Black represents the price when the report was produced
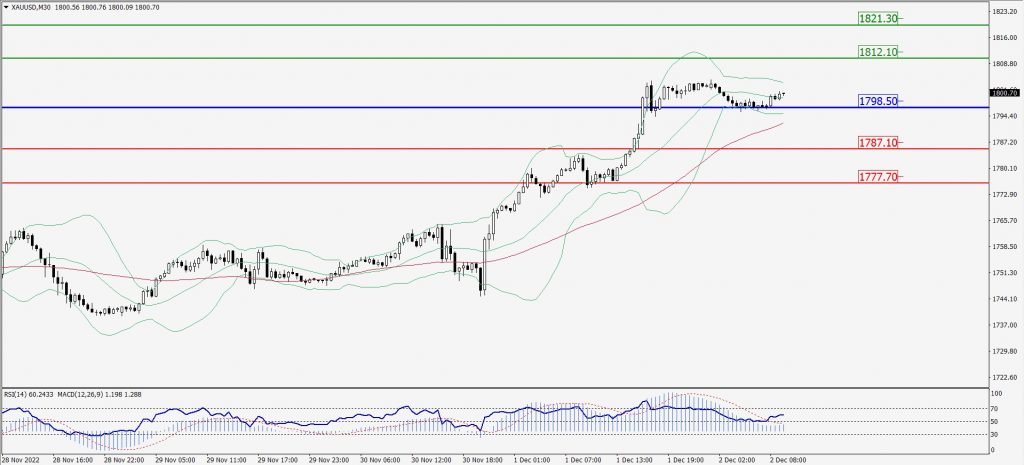
XAU/USD Intraday: Support level at 1798.50
Our pivot point is 1798.50
Preferable Price Action: Further upside to 1812.10 and 1821.30
Alternative Price Action: If the price gives a downside breakout of a pivot, then the price extends to 1787.10 and 1777.70.
Comment: MACD is positive territory and Pairs above its 20MA & 55MA.
Green Lines Indicate Resistance Levels – Red Lines Indicate Support Levels
Light Blue is a Pivot Point – Black represents the price when the report was produced
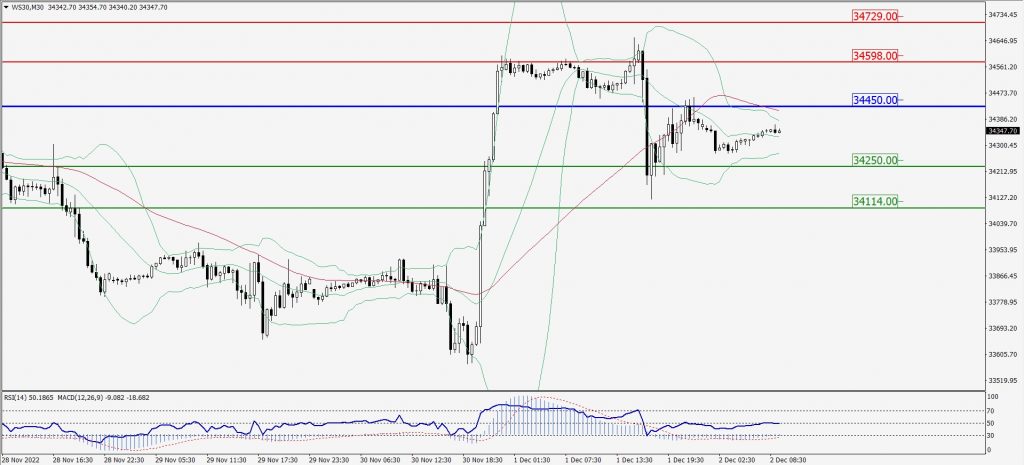
Dow Jones Intraday: In a consolidation zone
Our pivot point is 34,450.00
Preferable Price Action: Take sell positions below the pivot with targets at 34,250.00 & 34,114.00.
Alternative Price Action: Above 34,450.00 looks for further upside to 34,598.00 & 34,729.00.
Comment: RSI at 50 levels and Pairs below 55MA.
Green Lines Indicate Resistance Levels – Red Lines Indicate Support Levels
Light Blue is a Pivot Point – Black represents the price when the report was produced