Market Wrap: Stocks, Bonds, Commodities
US stocks closed lower for a second straight session on Tuesday after data indicating that the labour market remained on solid ground dimmed hopes the Federal Reserve might have enough reason to begin reducing the size of its interest rate hikes.
The Dow Jones Industrial Average fell 79.75 points to 32,653.20, the S&P 500 lose 15.88 points to 3,856.10 and the Nasdaq Composite subtract 97.30 points to 10,890.84.
MSCI’s index of Asia-Pacific stocks outside Japan is ascend 0.75% to 542.11 levels. Australian index higher 0.14% to 6,986.70. Japanese Nikkei Index drop 0.06% to 27,663.39.
European stocks were positive on Wednesday, with the Stoxx Europe 50 Index rose 0.34% to 3,664.55, Germany’s DAX ascend 0.16% to 13,358.34, and France’s CAC up 0.46% to 6,357.67, and U.K.’s FTSE 100 surged 0.11% to 7,195.10.
Benchmark 10-year U.S. Treasury fell as demand for safe assets ascend again, today 10-year bond yields a negative 0.39% to 4.0360.
Oil prices rose in early trade on Wednesday after industry data showed a surprise drop in US crude stockpiles, suggesting demand is holding up despite steep interest rate hikes dampening global growth.
Spot Brent crude oil add 0.97% to $95.54 per barrel. US West Texas Intermediate crude is up 1.15% to $89.41 a barrel.
The yellow metal gold is advance 0.45% to 1,656.85 dollars per ounce.
Market Wrap: Forex
The U.S. dollar slipped from near a one-week peak versus major peers on Wednesday, with traders on tenterhooks before a looming Federal Reserve rate decision that should also give clues on the future policy path.
Today, the U.S. dollar index measures the Greenback against a trade-weighted basket of six major currencies, which is fell 0.18% to 111.160.
The Euro US Dollar (EUR/USD) is a widely traded pair that is up 0.20% today. This left the pair trading around $0.98940.
The Japanese yen was positive against the U.S. dollar on Wednesday as the stock up. Today USD/JPY is drop 0.68% to 147.270 level.
Another commodity-related currency positive against the U.S dollar, AUD/USD surged 0.41% to 0.64220, and NZD/USD up 0.65 to 0.58790 level.
EUR/USD Intraday: Trend on the downside
Our pivot point is at 0.99000
Preferable Price Action: Take sell positions below pivot level with targets at 0.98420 & 0.97990 in extension.
Alternative Price Action: Above pivot looks for a further upside to 0.99530 & 0.99960.
Comment: RSI below 50 levels and Pairs below its 20MA & 55MA.
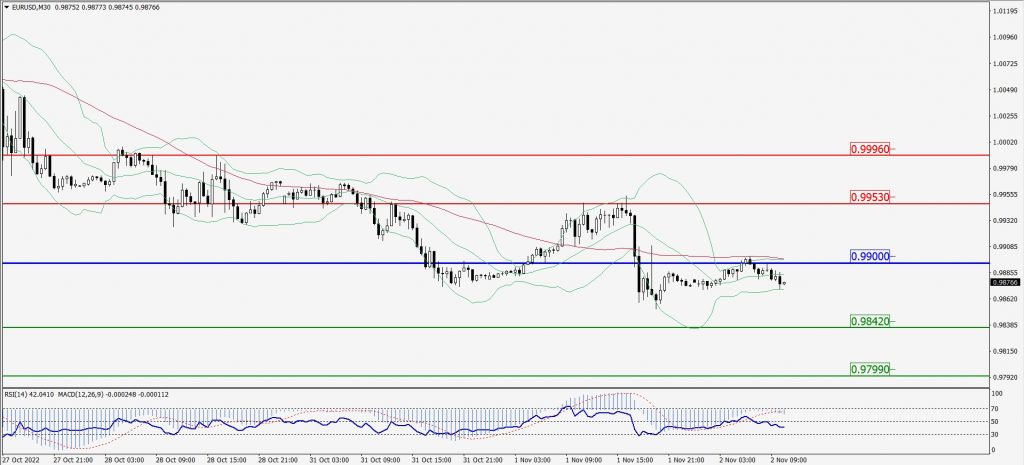
Green Lines Indicate Resistance Levels – Red Lines Indicate Support Levels
Light Blue is a Pivot Point – Black represents the price when the report was produced
GBP/USD Intraday: Trend on the downside
Our pivot point is at 1.15190
Preferable Price Action: Sell positions below pivot with targets at 1.14700 & 1.14380 in extension.
Alternative Price Action: The price above pivot would call for further upside to 1.15600 & 1.15870.
Comment: RSI below 50 levels and Pairs below its 20MA & 55MA.
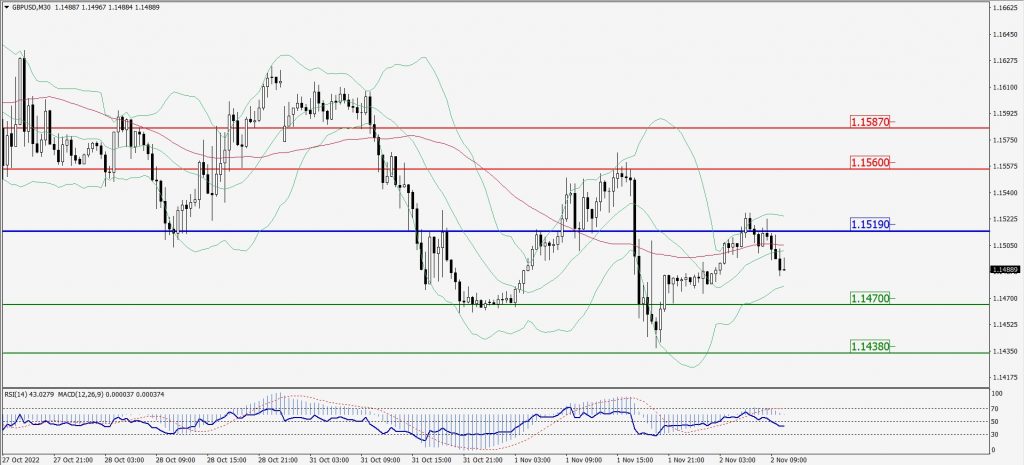
Green Lines Indicate Resistance Levels – Red Lines Indicate Support Levels
Light Blue is a Pivot Point – Black represents the price when the report was produced
USD/JPY Intraday: Trend on the downside
Our pivot point is at 147.930
Preferable Price Action: Sell position below pivot with the target at 146.930 and 146.120 in extension.
Alternative Price Action: The upside breakout of the pivot would call for 148.860 and 149.640.
Comment: MACD is negative territory and Pairs below its 20MA & 55MA.
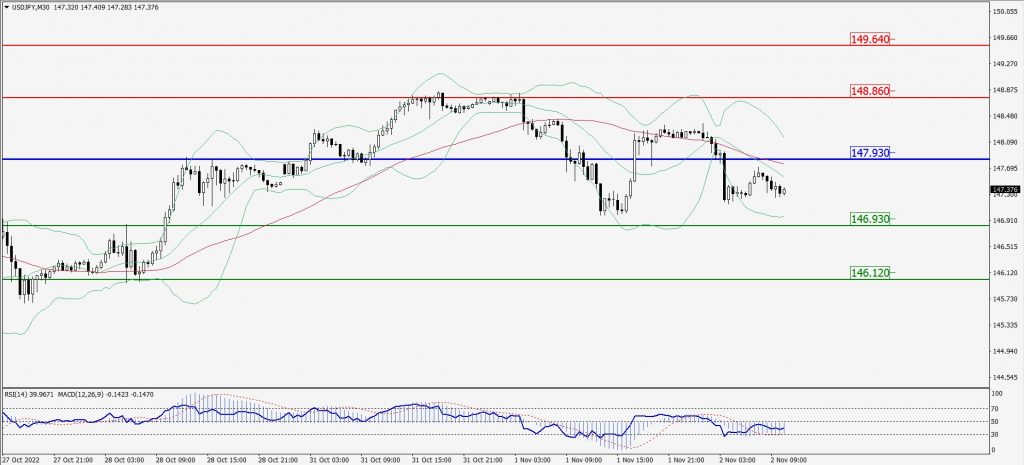
Green Lines Indicate Resistance Levels – Red Lines Indicate Support Levels
Light Blue is a Pivot Point – Black represents the price when the report was produced
AUD/USD Intraday: In a consolidation zone
Our pivot point is at 0.64320
Preferable Price Action: Sell Positions below pivot with targets at 0.63870 & 0.63540 in extension.
Alternative Price Action: Above pivot looks for a further upside with 0.64730 & 0.65060 as targets.
Comment: RSI at 50 levels.
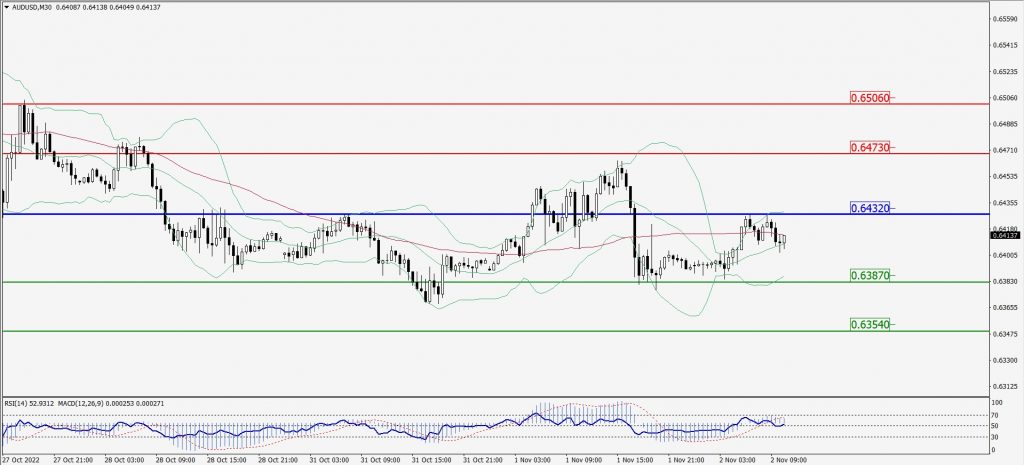
Green Lines Indicate Resistance Levels – Red Lines Indicate Support Levels
Light Blue is a Pivot Point – Black represents the price when the report was produced
CRUDEOIL Intraday: Support level at 88.46
Our pivot point is at 88.46
Preferable Price Action: Above pivots buy oil with 90.12 & 91.30 as targets.
Alternative Price Action: Sell crude below pivot with targets at 86.84 and 85.74 in extension.
Comment: MACD is in the positive territory and Pairs above 55MA.
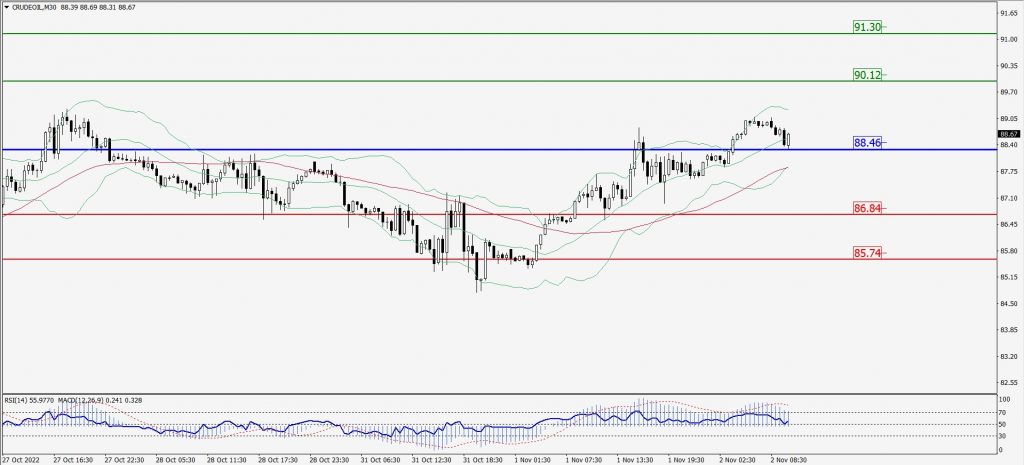
Green Lines Indicate Resistance Levels – Red Lines Indicate Support Levels
Light Blue is a Pivot Point – Black represents the price when the report was produced
XAU/USD Intraday: Trend on the upside
Our pivot point is 1649.90
Preferable Price Action: Further upside to 1661.30 and 1671.00
Alternative Price Action: If the price gives a downside breakout of a pivot, then the price extends to 1639.50 and 1631.40.
Comment: MACD is positive territory and Pairs above its 20MA & 55MA.
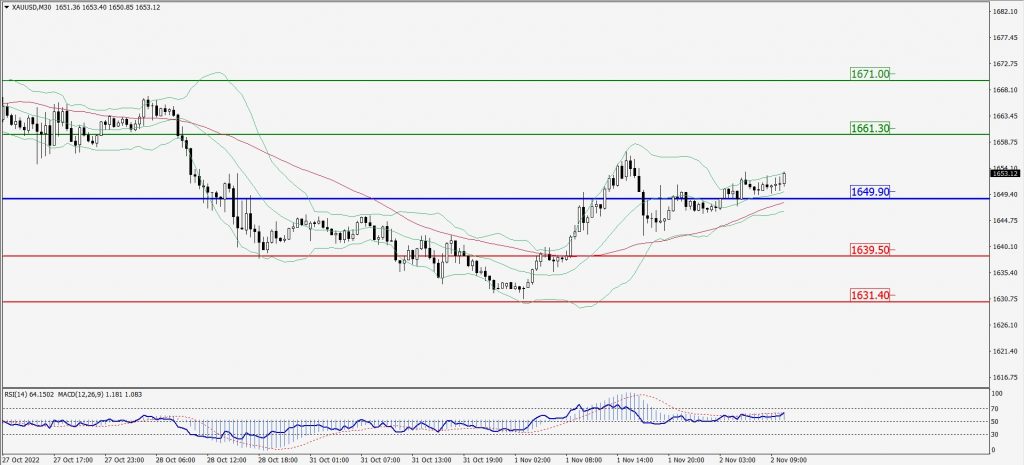
Green Lines Indicate Resistance Levels – Red Lines Indicate Support Levels
Light Blue is a Pivot Point – Black represents the price when the report was produced
Dow Jones Intraday: Trend on the downside
Our pivot point is 32,811.00
Preferable Price Action: Take sell positions below pivot with targets at 32,599.00 & 32,436.00.
Alternative Price Action: Above 32,811.00 looks for further upside to 32,989.00 & 33,151.00.
Comment: RSI below 50 levels and Pairs below 55MA.
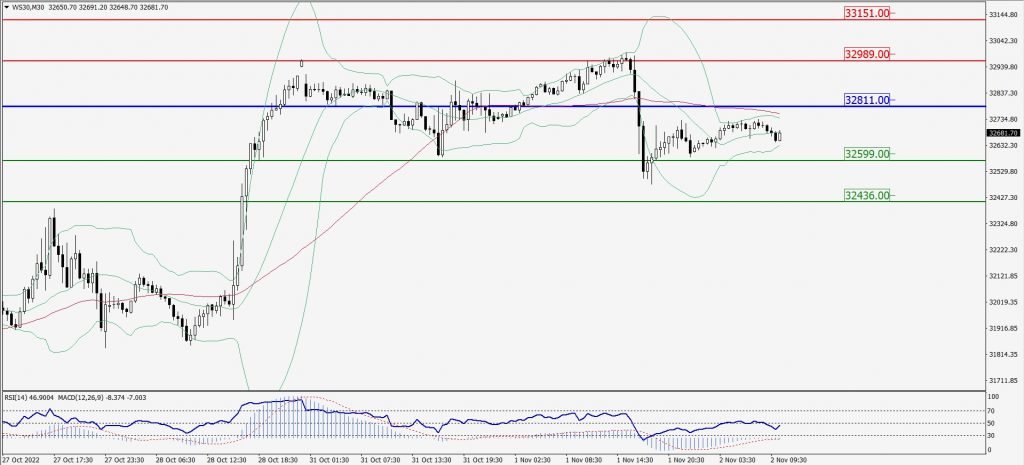
Green Lines Indicate Resistance Levels – Red Lines Indicate Support Levels
Light Blue is a Pivot Point – Black represents the price when the report was produced