Market Wrap: Stocks, Bonds, Commodities
US stocks ended sharply lower on Wednesday, as comments from Fed Chair Jerome Powell shattered initial optimism over a Fed policy statement that raised interest rates by 75 basis points but signalled that smaller rate hikes may be on the horizon.
The Dow Jones Industrial Average fell 505.44 points to 32,147.76, the S&P 500 lose 96.41 points to 3,759.69 and the Nasdaq Composite subtract 366.05 points to 10,524.80.
MSCI’s index of Asia-Pacific stocks outside Japan is ascend 1.76% to 533.20 levels. Australian index lower 1.84% to 6,857.90. Japanese Nikkei Index drop 0.06% to 27,663.39.
European stocks were negative on Thursday, with the Stoxx Europe 50 Index fell 0.86% to 3,590.95, Germany’s DAX drop 0.76% to 13,151.98, and France’s CAC down 0.85% to 6,223.64, and U.K.’s FTSE 100 slipped 0.63% to 7,100.70.
Benchmark 10-year U.S. Treasury fell as demand for safe assets ascend again, today 10-year bond yields a positive 1.91% to 4.1380.
Oil slipped on Thursday as a U.S. interest rate hike pushed up the dollar and increased fears of a global recession that would crimp fuel demand, although losses were capped by concerns over tight supply.
Spot Brent crude oil subtract 1.11% to $95.12 per barrel. US West Texas Intermediate crude is down 1.27% to $88.83 a barrel.
The yellow metal gold is advance 1.28% to 1,628.65 dollars per ounce.
Market Wrap: Forex
The dollar was on the front foot on Thursday after Federal Reserve Chair Jerome Powell signalled US rates would likely rise further than expected, disappointing traders’ hopes for a change in tone, and shifting the focus to Friday’s jobs data.
Today, the U.S. dollar index measures the Greenback against a trade-weighted basket of six major currencies, which is rose 1.10% to 112.460.
The Euro US Dollar (EUR/USD) is a widely traded pair that is down 0.47% today. This left the pair trading around $0.97730.
The Japanese yen was positive against the U.S. dollar on Thursday as the stock up. Today USD/JPY is ascend 0.05% to 147.970 level.
Another commodity-related currency negative against the U.S dollar, AUD/USD slipped 0.54% to 0.63140, and NZD/USD down 0.64 to 0.57830 level.
EUR/USD Intraday: Trend on the downside
Our pivot point is at 0.98200
Preferable Price Action: Take sell positions below pivot level with targets at 0.97450 & 0.96980 in extension.
Alternative Price Action: Above pivot looks for a further upside to 0.98830 & 0.99330.
Comment: RSI below 50 levels and Pairs below its 20MA & 55MA.
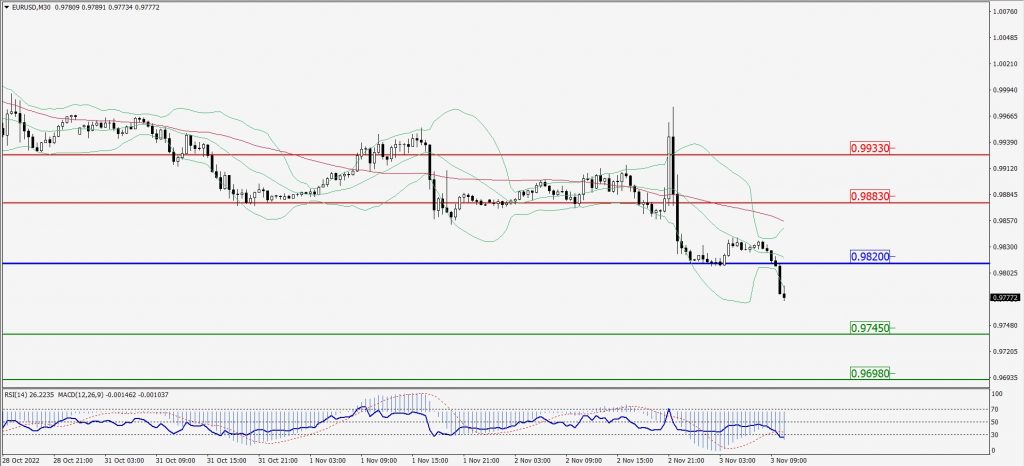
Green Lines Indicate Resistance Levels – Red Lines Indicate Support Levels
Light Blue is a Pivot Point – Black represents the price when the report was produced
GBP/USD Intraday: Trend on the downside
Our pivot point is at 1.13860
Preferable Price Action: Sell positions below pivot with targets at 1.12880 & 1.12220 in extension.
Alternative Price Action: The price above pivot would call for further upside to 1.14730 & 1.15410.
Comment: RSI below 50 levels and Pairs below its 20MA & 55MA.
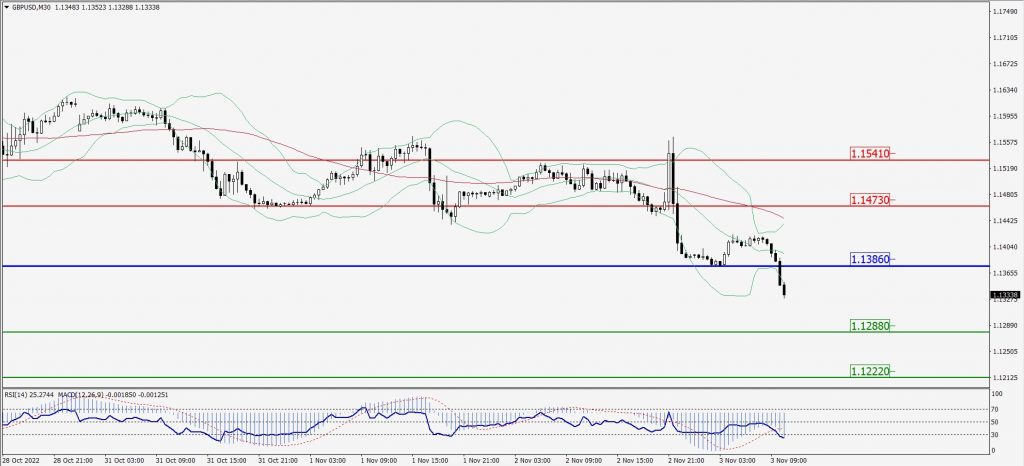
Green Lines Indicate Resistance Levels – Red Lines Indicate Support Levels
Light Blue is a Pivot Point – Black represents the price when the report was produced
USD/JPY Intraday: Support level at 147.660
Our pivot point is at 147.660
Preferable Price Action: Buy position above pivot with the target at 148.780 and 149.650 in extension.
Alternative Price Action: The downside breakout of the pivot would call for 146.770 and 146.070.
Comment: MACD is positive territory and Pairs above its 20MA & 55MA.
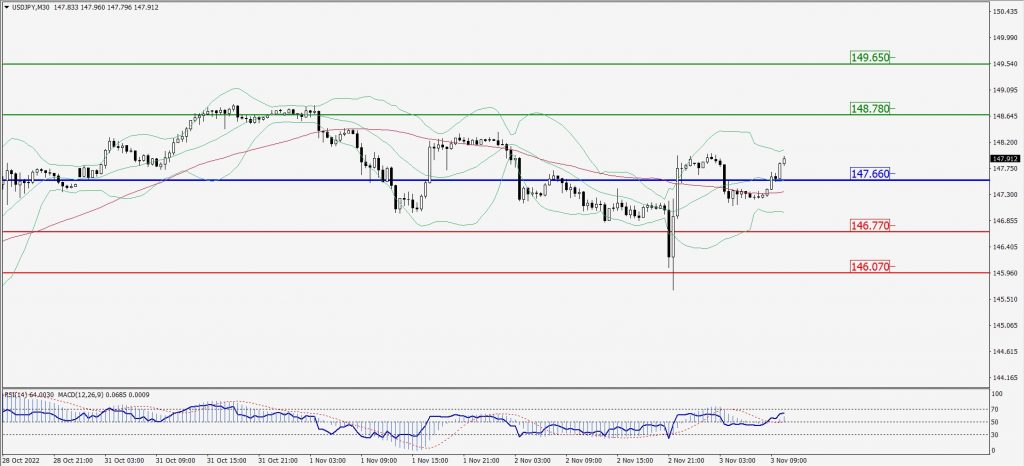
Green Lines Indicate Resistance Levels – Red Lines Indicate Support Levels
Light Blue is a Pivot Point – Black represents the price when the report was produced
AUD/USD Intraday: Trend on the downside
Our pivot point is at 0.63340
Preferable Price Action: Sell Positions below pivot with targets at 0.62800 & 0.62450 in extension.
Alternative Price Action: Above pivot looks for a further upside with 0.63760 & 0.64140 as targets.
Comment: RSI below 50 levels and Pairs below its 20MA & 55MA.
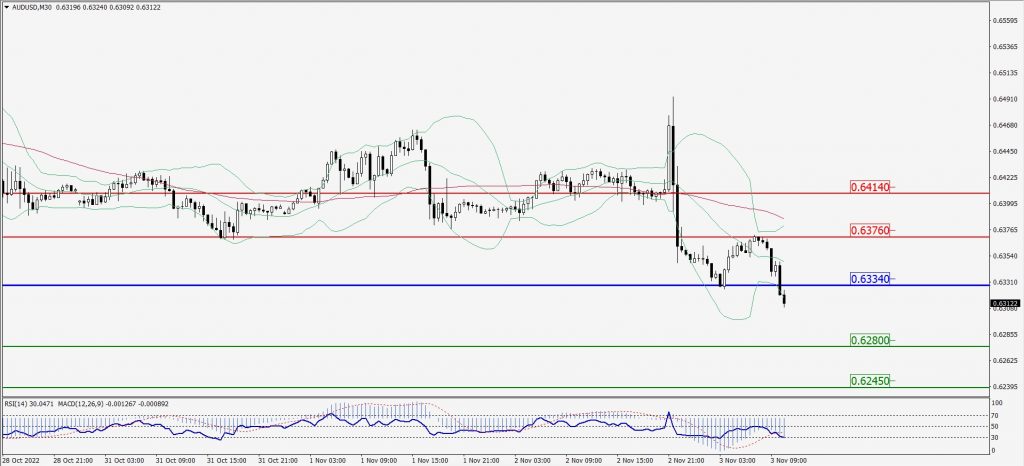
Green Lines Indicate Resistance Levels – Red Lines Indicate Support Levels
Light Blue is a Pivot Point – Black represents the price when the report was produced
CRUDEOIL Intraday: Resistance level at 88.82
Our pivot point is at 88.82
Preferable Price Action: Below pivots sell oil with 87.60 & 86.65 as targets.
Alternative Price Action: Buy crude above pivot with targets at 89.97 and 90.89 in extension.
Comment: MACD is in the negative territory and Pairs below its 20MA & 55MA.
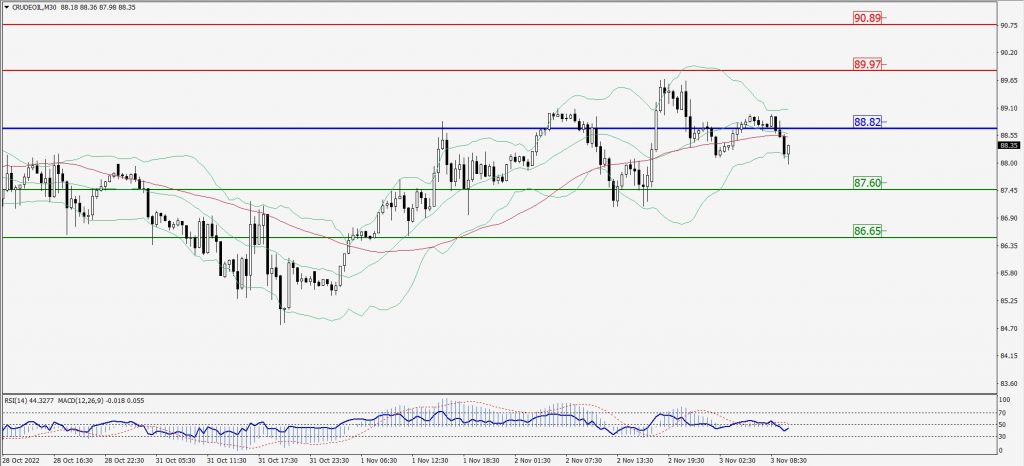
Green Lines Indicate Resistance Levels – Red Lines Indicate Support Levels
Light Blue is a Pivot Point – Black represents the price when the report was produced
XAU/USD Intraday: Trend on the downside
Our pivot point is 1636.40
Preferable Price Action: Further downside to 1622.00 and 1612.60
Alternative Price Action: If the price gives an upside breakout of a pivot, then the price extends to 1648.30 and 1658.80.
Comment: MACD is negative territory and Pairs below its 20MA & 55MA.
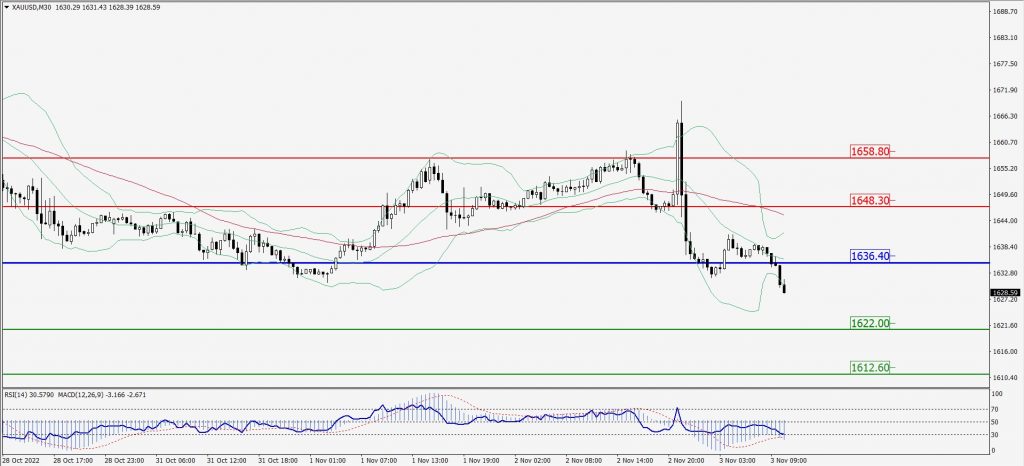
Green Lines Indicate Resistance Levels – Red Lines Indicate Support Levels
Light Blue is a Pivot Point – Black represents the price when the report was produced
Dow Jones Intraday: Resistance level at 32,257.00
Our pivot point is 32,257.00
Preferable Price Action: Take sell positions below pivot with targets at 31,956.00 & 31,747.00.
Alternative Price Action: Above 32,257.00 looks for further upside to 32,494.00 & 32,710.00.
Comment: RSI below 50 levels and Pairs below 55MA.
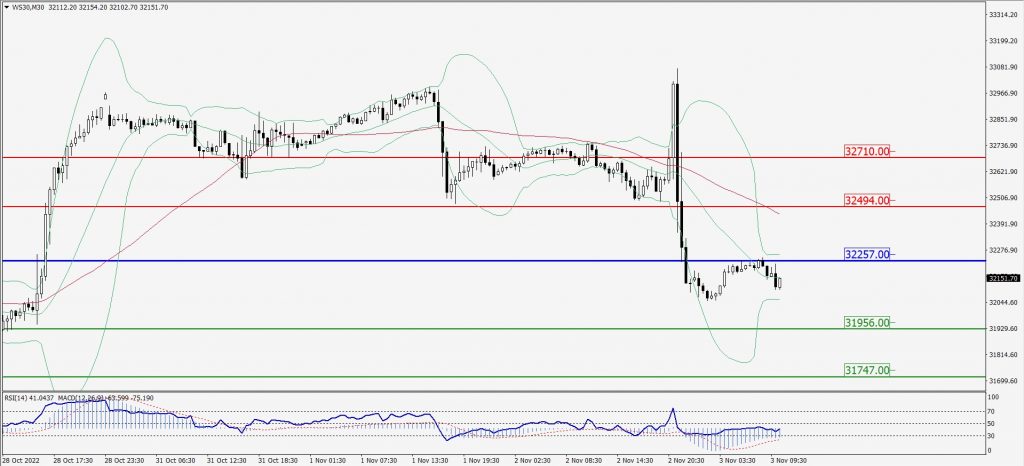
Green Lines Indicate Resistance Levels – Red Lines Indicate Support Levels
Light Blue is a Pivot Point – Black represents the price when the report was produced