Market Wrap: Stocks, Bonds, Commodities
Australia stocks were higher after the close on Tuesday, as gains in the A-REITs, Telecoms Services and Consumer Discretionary sectors led shares higher.
The Dow Jones Industrial Average rose 417.06 points to 31,499.62, the S&P 500 gain 44.59 points to 3,797.34 and the Nasdaq Composite add 92.90 points to 10,952.61.
MSCI’s index of Asia-Pacific stocks outside Japan is drop 0.26% to 520.39 levels. Australian index higher 0.28% to 6,798.60. Japanese Nikkei Index ascend 1.02% to 27,250.28.
European stocks were positive on Tuesday, with the Stoxx Europe 50 Index rose 0.52% to 3,547.25, Germany’s DAX ascend 0.32% to 12,970.80, and France’s CAC up 0.52% to 6,163.41, and U.K.’s FTSE 100 slipped 0.34% to 6,996.45.
Benchmark 10-year U.S. Treasury fell as demand for safe assets ascend again, today 10-year bond yields a negative 1.24% to 4.1800.
Oil prices rose on Tuesday as the U.S. dollar eased against major peers but gains were limited by worries of slowing global fuel demand growth amid bearish economic data from key oil importing economies such as China.
Spot Brent crude oil subtract 0.34% to $90.91 per barrel. US West Texas Intermediate crude is down 0.44% to $84.22 a barrel.
The yellow metal gold is decline 0.18% to 1,650.95 dollars per ounce.
Market Wrap: Forex
The U.S. dollar stabilized at lower levels in early European trading Tuesday as traders factored in a potentially less hawkish Federal Reserve, while sterling benefited from the increased risk sentiment as Rishi Sunak prepares to become Britain’s new prime minister.
Today, the U.S. dollar index measures the Greenback against a trade-weighted basket of six major currencies, which is rose 0.02% to 111.920.
The Euro US Dollar (EUR/USD) is a widely traded pair that is down 0.08% today. This left the pair trading around $0.98660.
The Japanese yen was positive against the U.S. dollar on Tuesday as the stock up. Today USD/JPY is drop 0.03% to 148.920 level.
Another commodity-related currency positive against the U.S dollar, AUD/USD surged 0.32% to 0.63310, and NZD/USD up 0.23 to 0.57060 level.
EUR/USD Intraday: Trend on the downside
Our pivot point is at 0.98870
Preferable Price Action: Take sell positions below pivot level with targets at 0.98160 & 0.97610 in extension.
Alternative Price Action: Above pivot looks for a further upside to 0.99420 & 0.99860.
Comment: RSI below 50 levels and Pairs below 20MA.
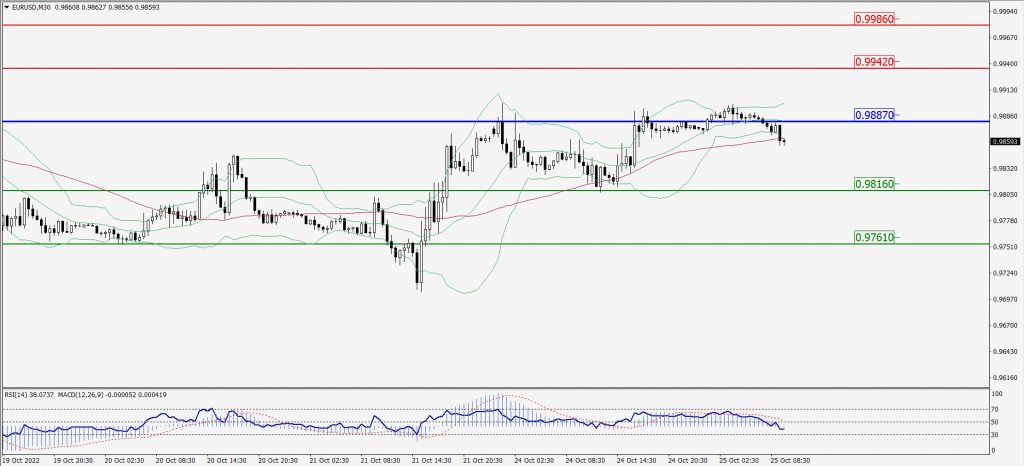
Green Lines Indicate Resistance Levels – Red Lines Indicate Support Levels
Light Blue is a Pivot Point – Black represents the price when the report was produced
GBP/USD Intraday: Resistance level at 1.13300
Our pivot point is at 1.13300
Preferable Price Action: Sell positions below pivot with targets at 1.12300 & 1.11600 in extension.
Alternative Price Action: The price above pivot would call for further upside to 1.14170 & 1.14880.
Comment: RSI below 50 levels and Pairs below its 20MA & 55MA.
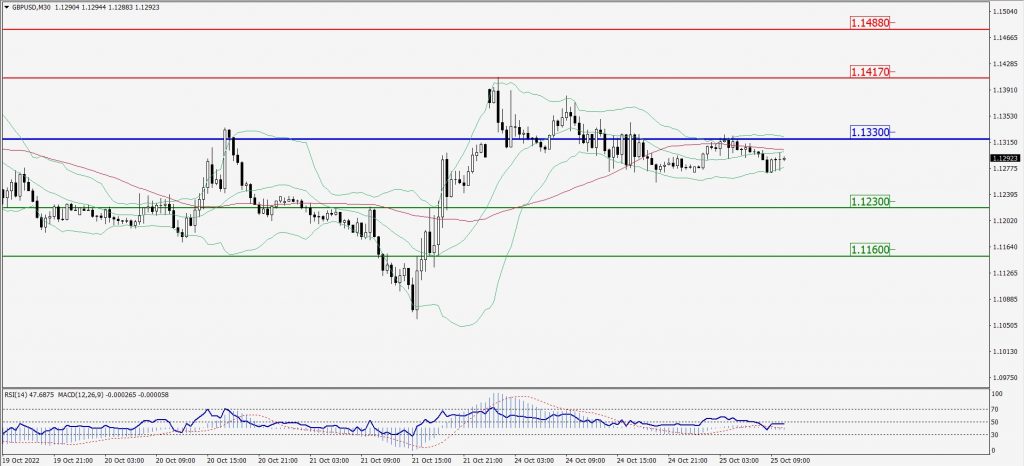
Green Lines Indicate Resistance Levels – Red Lines Indicate Support Levels
Light Blue is a Pivot Point – Black represents the price when the report was produced
USD/JPY Intraday: In a consolidation zone
Our pivot point is at 148.850
Preferable Price Action: Buy position above pivot with the target at 149.800 and 150.610 in extension.
Alternative Price Action: The downside breakout of the pivot would call for 147.970 and 147.220.
Comment: MACD is flat territory and Pairs above 20MA.
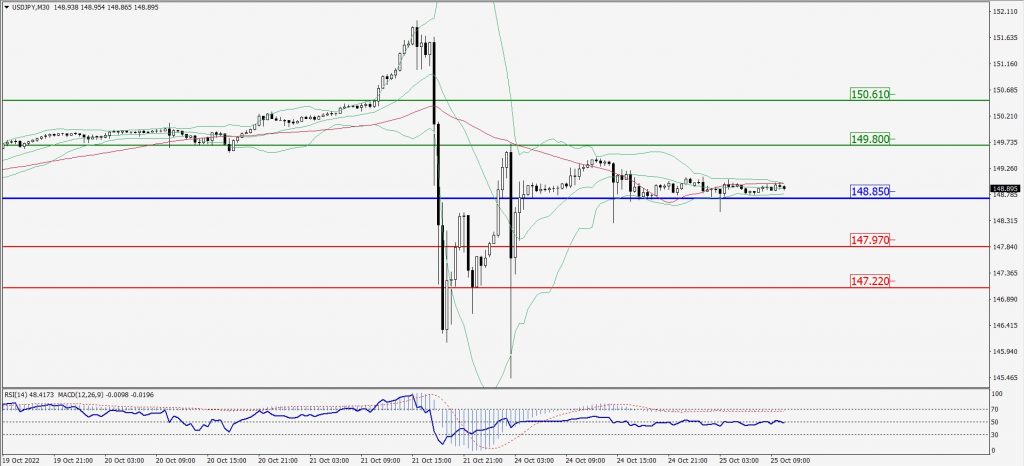
Green Lines Indicate Resistance Levels – Red Lines Indicate Support Levels
Light Blue is a Pivot Point – Black represents the price when the report was produced
AUD/USD Intraday: Trend on the upside
Our pivot point is at 0.63190
Preferable Price Action: Buy Positions above pivot with targets at 0.63640 & 0.63960 in extension.
Alternative Price Action: Below pivot looks for a further downside with 0.62800 & 0.62510 as targets.
Comment: RSI at 50 levels and Pairs above 55MA.
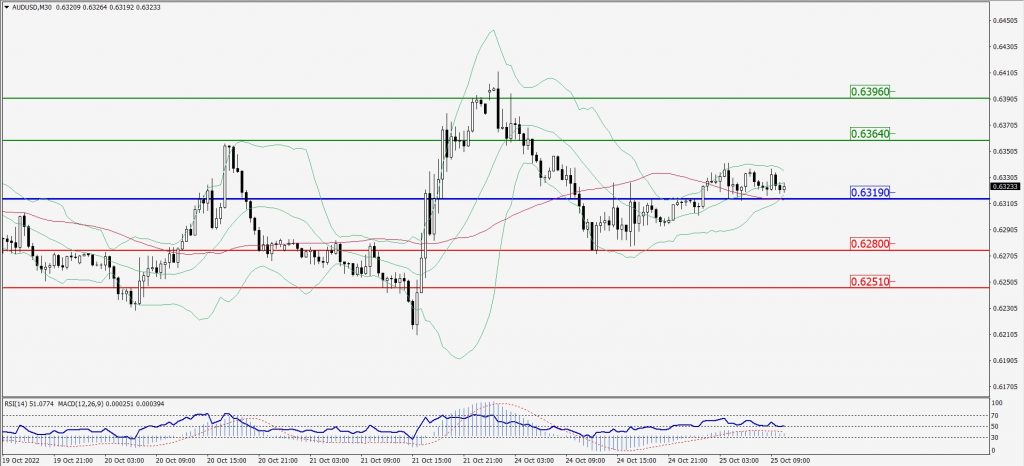
Green Lines Indicate Resistance Levels – Red Lines Indicate Support Levels
Light Blue is a Pivot Point – Black represents the price when the report was produced
CRUDEOIL Intraday: Trend on the downside
Our pivot point is at 84.43
Preferable Price Action: Below pivots sell oil with 83.35 & 82.59 as targets.
Alternative Price Action: Buy crude above pivot with targets at 85.34 and 86.08 in extension.
Comment: MACD is in the negative territory and Pairs below its 20MA & 55MA.
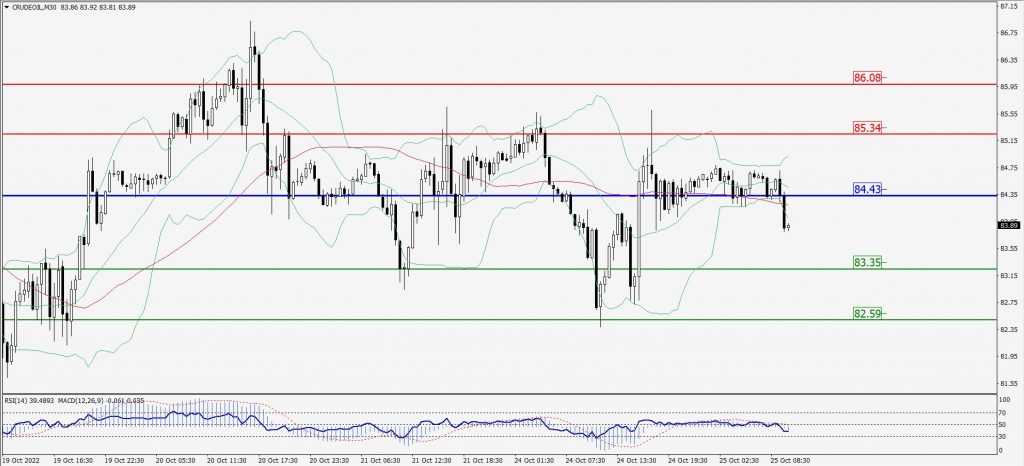
Green Lines Indicate Resistance Levels – Red Lines Indicate Support Levels
Light Blue is a Pivot Point – Black represents the price when the report was produced
XAU/USD Intraday: Trend on the downside
Our pivot point is 1652.60
Preferable Price Action: Further downside to 1639.70 and 1629.80
Alternative Price Action: If the price gives an upside breakout of a pivot, then the price extends to 1666.20 and 1678.40.
Comment: MACD is negative territory and Pairs below its 20MA & 55MA.
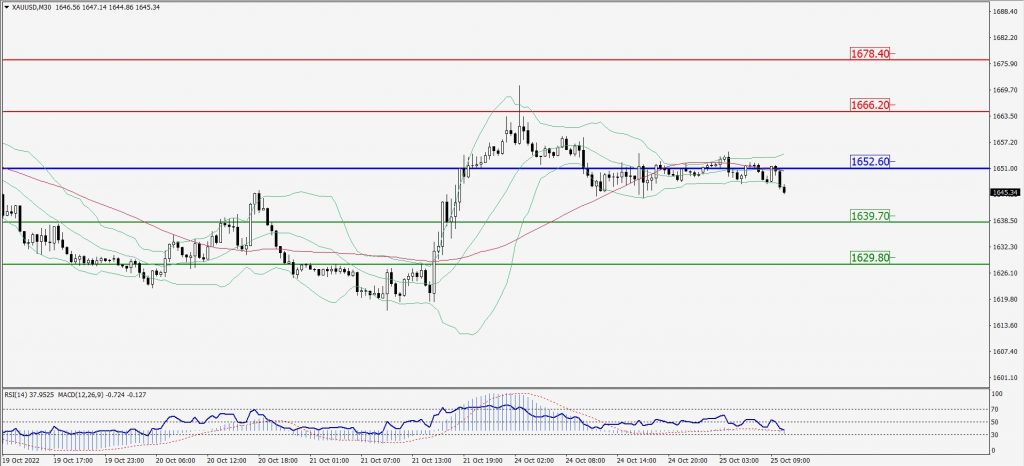
Green Lines Indicate Resistance Levels – Red Lines Indicate Support Levels
Light Blue is a Pivot Point – Black represents the price when the report was produced
Dow Jones Intraday: Trend on the upside
Our pivot point is 31,441.00
Preferable Price Action: Take buy positions above pivot with targets at 31,844.00 & 32,129.00.
Alternative Price Action: Below 31,441.00 looks for further downside to 31,106.00 & 30,848.00.
Comment: RSI above 50 levels and Pairs above 55MA.
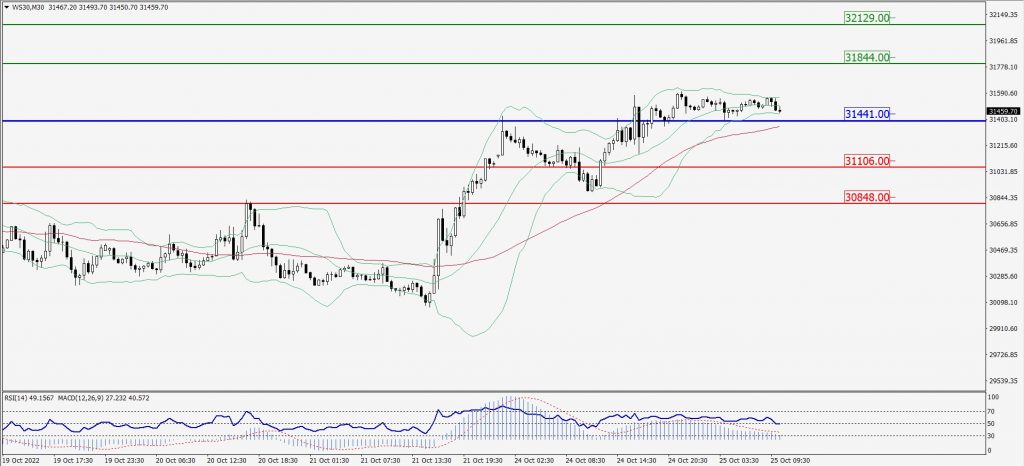
Green Lines Indicate Resistance Levels – Red Lines Indicate Support Levels
Light Blue is a Pivot Point – Black represents the price when the report was produced