Market Wrap: Stocks, Bonds, Commodities
Australia stocks were higher after the close on Monday, as gains in the Gold, Metals & Mining and Materials sectors led shares higher.
The Dow Jones Industrial Average rose 748.97 points to 31,082.56, the S&P 500 gain 86.97 points to 3,752.75 and the Nasdaq Composite add 244.87 points to 10,859.72.
MSCI’s index of Asia-Pacific stocks outside Japan is drop 2.71% to 522.77 levels. Australian index higher 1.54% to 6,779.40. Japanese Nikkei Index ascend 0.31% to 26,974.90.
European stocks were positive on Monday, with the Stoxx Europe 50 Index rose 0.04% to 3,476.85, Germany’s DAX ascend 0.24% to 12,760.84, and France’s CAC up 0.17% to 6,045.41, and U.K.’s FTSE 100 slipped 0.77% to 6,914.40.
Benchmark 10-year U.S. Treasury fell as demand for safe assets ascend again, today 10-year bond yields a negative 0.48% to 4.1940.
Oil prices slid more than 1% on Monday after Chinese data showed that demand from the world’s largest crude importer remained lacklustre in September as strict COVID-19 policies and fuel export curbs depressed consumption.
Spot Brent crude oil subtract 2.05% to $89.41 per barrel. US West Texas Intermediate crude is down 2.38% to $83.03 a barrel.
The yellow metal gold is decline 0.33% to 1,651.40 dollars per ounce.
Market Wrap: Forex
Suspected Bank of Japan (BOJ) intervention gave only brief respite to the Japanese yen as the dollar stayed strong on Monday, while sterling wavered as former finance minister Rishi Sunak emerged as frontrunner to become Britain’s prime minister.
Today, the U.S. dollar index measures the Greenback against a trade-weighted basket of six major currencies, which is rose 0.25% to 112.240.
The Euro US Dollar (EUR/USD) is a widely traded pair that is down 0.31% today. This left the pair trading around $0.98290.
The Japanese yen was positive against the U.S. dollar on Monday as the stock up. Today USD/JPY is ascend 1.10% to 149.300 level.
Another commodity-related currency negative against the U.S dollar, AUD/USD slipped 1.36% to 0.62900, and NZD/USD down 0.93 to 0.56940 level.
EUR/USD Intraday: In a consolidation zone
Our pivot point is at 0.98330
Preferable Price Action: Take buy positions above pivot level with targets at 0.98770 & 0.99190 in extension.
Alternative Price Action: Below pivot looks for a further downside to 0.97920 & 0.97590.
Comment: RSI at 50 levels and Pairs above 55MA.
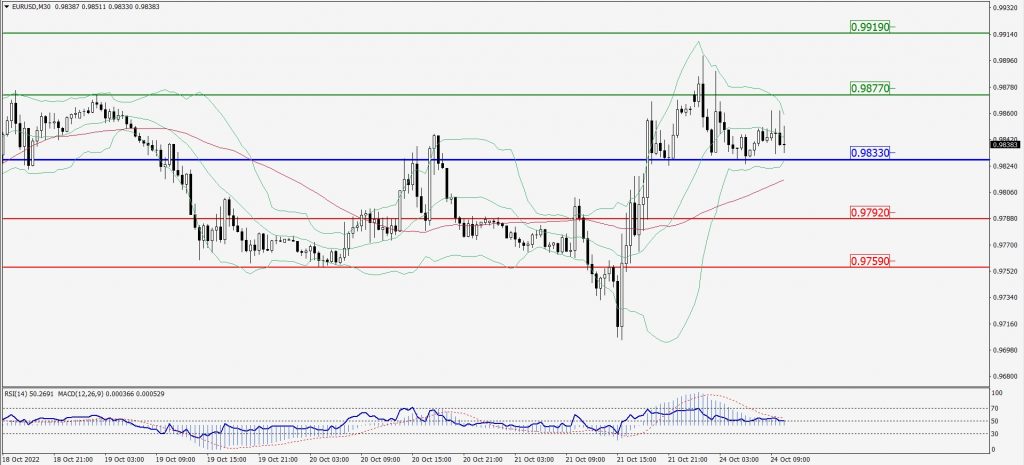
Green Lines Indicate Resistance Levels – Red Lines Indicate Support Levels
Light Blue is a Pivot Point – Black represents the price when the report was produced
GBP/USD Intraday: Trend on the upside
Our pivot point is at 1.13140
Preferable Price Action: Buy positions above pivot with targets at 1.14230 & 1.15040 in extension.
Alternative Price Action: The price below pivot would call for further downside to 1.12240 & 1.11460.
Comment: RSI above 50 levels and Pairs above 55MA.
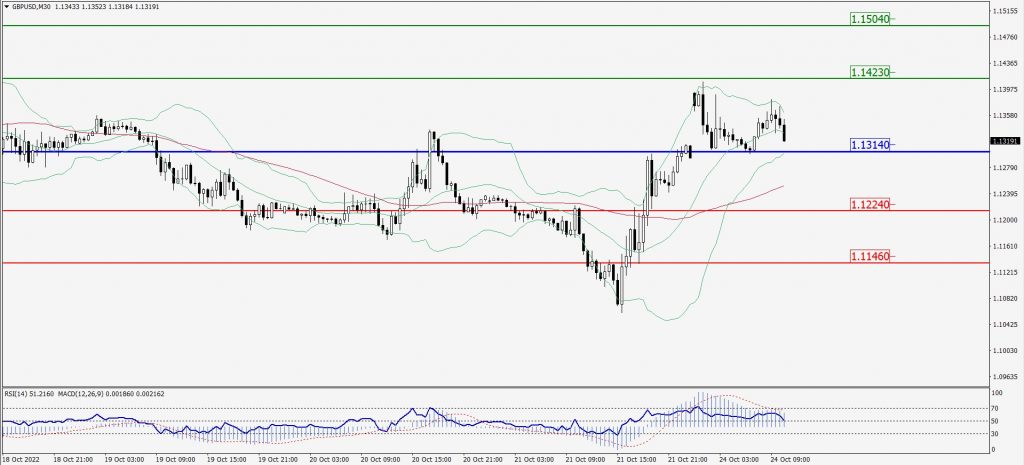
Green Lines Indicate Resistance Levels – Red Lines Indicate Support Levels
Light Blue is a Pivot Point – Black represents the price when the report was produced
USD/JPY Intraday: Trend on the upside
Our pivot point is at 149.000
Preferable Price Action: Buy position above pivot with the target at 150.070 and 150.840 in extension.
Alternative Price Action: The downside breakout of the pivot would call for 147.970 and 147.090.
Comment: MACD is positive territory and Pairs above 20MA.
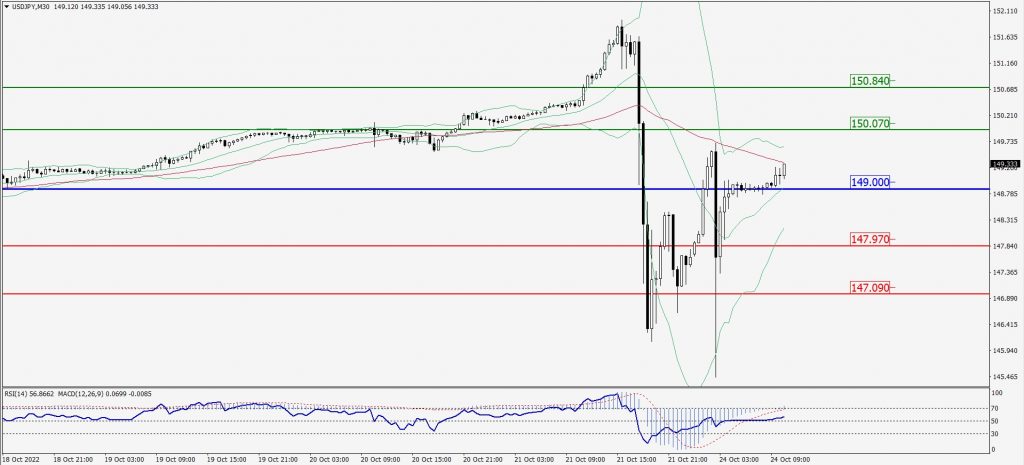
Green Lines Indicate Resistance Levels – Red Lines Indicate Support Levels
Light Blue is a Pivot Point – Black represents the price when the report was produced
AUD/USD Intraday: Trend on the downside
Our pivot point is at 0.63320
Preferable Price Action: Sell Positions below pivot with targets at 0.62820 & 0.62470 in extension.
Alternative Price Action: Above pivot looks for a further upside with 0.63740 & 0.64090 as targets.
Comment: RSI below 50 levels and Pairs below 20MA.
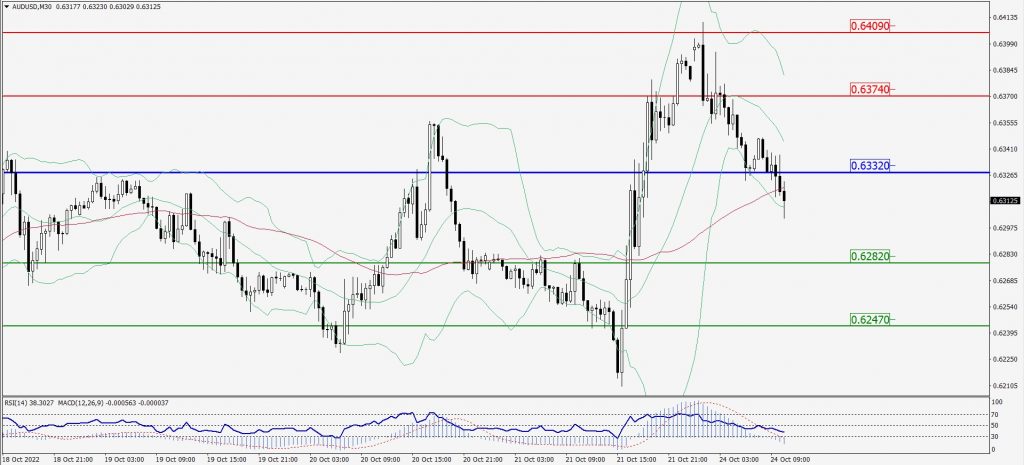
Green Lines Indicate Resistance Levels – Red Lines Indicate Support Levels
Light Blue is a Pivot Point – Black represents the price when the report was produced
CRUDEOIL Intraday: Trend on the downside
Our pivot point is at 84.40
Preferable Price Action: Below pivots sell oil with 82.70 & 81.53 as targets.
Alternative Price Action: Buy crude above pivot with targets at 85.72 and 86.86 in extension.
Comment: MACD is in the negative territory and Pairs below its 20MA & 55MA.
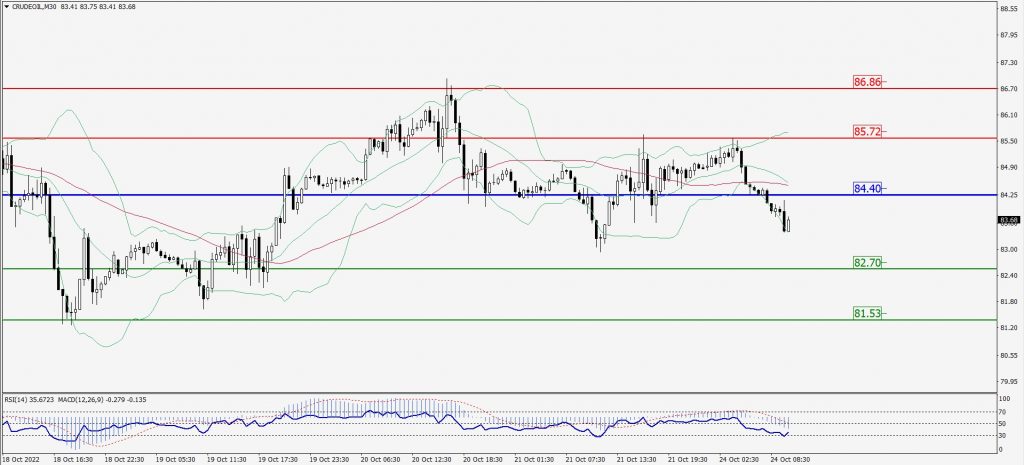
Green Lines Indicate Resistance Levels – Red Lines Indicate Support Levels
Light Blue is a Pivot Point – Black represents the price when the report was produced
XAU/USD Intraday: Resistance level at 1657.80
Our pivot point is 1657.80
Preferable Price Action: Further downside to 1641.00 and 1629.90
Alternative Price Action: If the price gives an upside breakout of a pivot, then the price extends to 1671.70 and 1684.00.
Comment: MACD is negative territory and Pairs below 20MA.
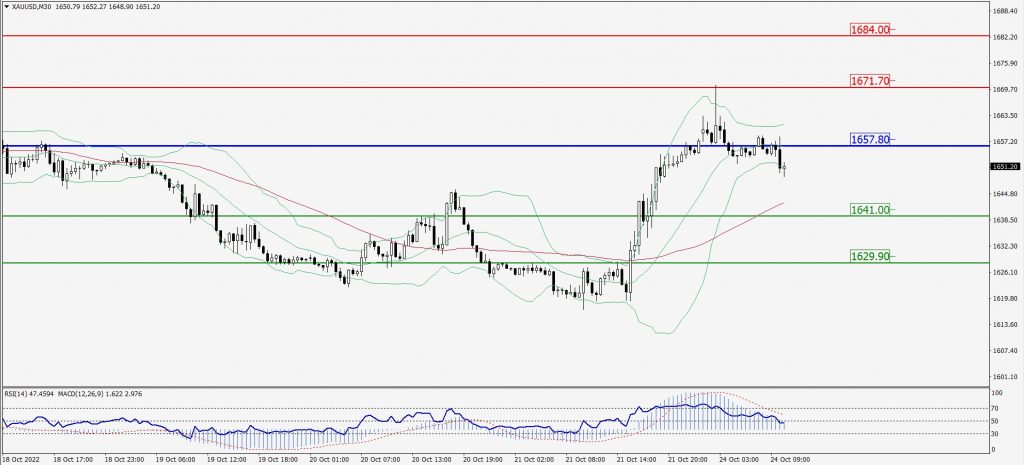
Green Lines Indicate Resistance Levels – Red Lines Indicate Support Levels
Light Blue is a Pivot Point – Black represents the price when the report was produced
Dow Jones Intraday: In a consolidation zone
Our pivot point is 30,933.00
Preferable Price Action: Take buy positions above pivot with targets at 31,256.00 & 31,544.00.
Alternative Price Action: Below 30,933.00 looks for further downside to 30,665.00 & 30,443.00.
Comment: RSI above 50 levels and Pairs above 55MA.
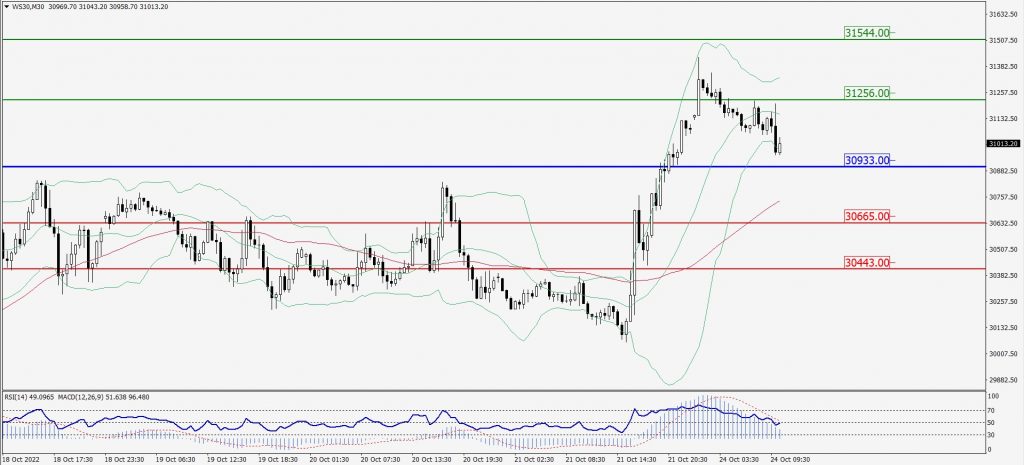
Green Lines Indicate Resistance Levels – Red Lines Indicate Support Levels
Light Blue is a Pivot Point – Black represents the price when the report was produced