Market Wrap: Stocks, Bonds, Commodities
US stocks closed lower on Wednesday, with indexes volatile after minutes from the Federal Reserve’s meeting in July suggested policymakers may be less aggressive than previously thought when they raise interest rates in September.
The Dow Jones Industrial Average fell 171.69 points to 33,980.32, the S&P 500 lose 31.16 points to 4,274.04 and the Nasdaq Composite subtract 164.43 points to 12,938.12.
MSCI’s index of Asia-Pacific stocks outside Japan is drop 0.78% to 645.61 levels. Australian index lower 0.21% to 7,112.80. Japanese Nikkei Index drop 0.96% to 28,942.14.
European stocks were mixed on Thursday, with the Stoxx Europe 50 Index fell 0.05% to 3,754.25, Germany’s DAX advaance 0.38% to 13,678.97, and France’s CAC ascend 0.10% to 6,535.08, and U.K.’s FTSE 100 sliped 0.25% to 7,495.84.
Benchmark 10-year U.S. Treasury fell as demand for safe assets ascend again, today 10-year bond yields a negative 0.25% to 2.8880.
Oil prices were little changed on Thursday as investors grappled with falling stockpiles in the United States, rising output from Russia and worries about a potential global recession.
Spot Brent crude oil down 0.18% to $93.50 per barrel. US West Texas Intermediate crude is down 0.26% to $87.91 a barrel.
The yellow metal gold is decline 0.04% to 1,775.85 dollars per ounce.
Market Wrap: Forex
The dollar was on the front foot on Thursday after minutes from the Federal Reserve’s July meeting pointed to U.S. interest rates staying higher for longer to bring down inflation.
Today, the U.S. dollar index measures the Greenback against a trade-weighted basket of six major currencies, which is rose 0.28% to 106.780.
The Euro US Dollar (EUR/USD) is a widely traded pair that is down 0.22% today. This left the pair trading around $1.01580.
The Japanese yen was positive against the U.S. dollar on Thursday as the stock up. Today USD/JPY is asced 0.23% to 135.310 level.
Another commodity-related currency negative against the U.S dollar, AUD/USD lose 0.17% to 0.69200, and NZD/USD down 0.38 to 0.62570 level.
EUR/USD Intraday: Resistance level at 1.01940
Our pivot point is at 1.01940
Preferable Price Action: Take sell positions below pivot level with targets at 1.01050 & 1.00440 in extension.
Alternative Price Action: Above pivot looks for a further upside to 1.02740 & 1.03420.
Comment: RSI below 50 levels and Pairs below its 20MA & 55MA.
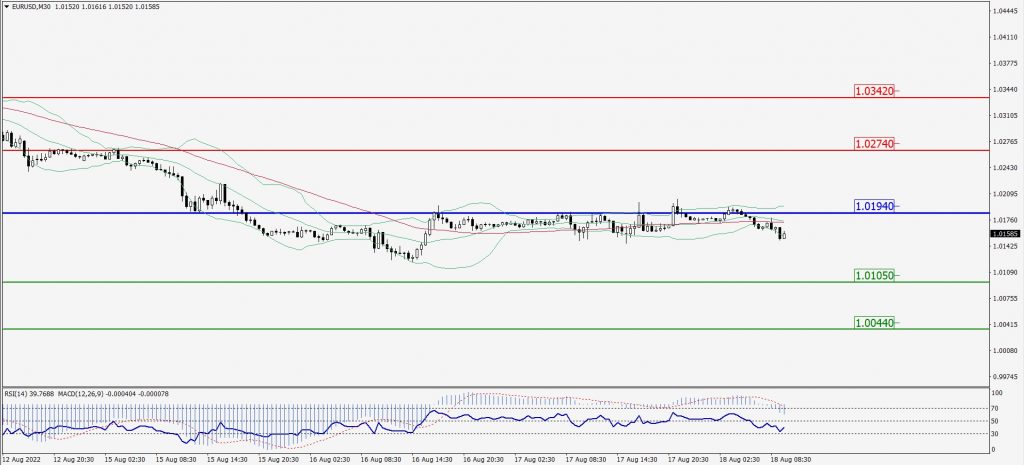
Green Lines Indicate Resistance Levels – Red Lines Indicate Support Levels
Light Blue is a Pivot Point – Black represents the price when the report was produced
GBP/USD Intraday: Trend on the downside
Our pivot point is at 1.20560
Preferable Price Action: Sell positions below pivot with targets at 1.19500 & 1.18700 in extension.
Alternative Price Action: The price above pivot would call for further upside to 1.21530 & 1.22280.
Comment: RSI below 50 levels and Pairs below its 20MA & 55MA.
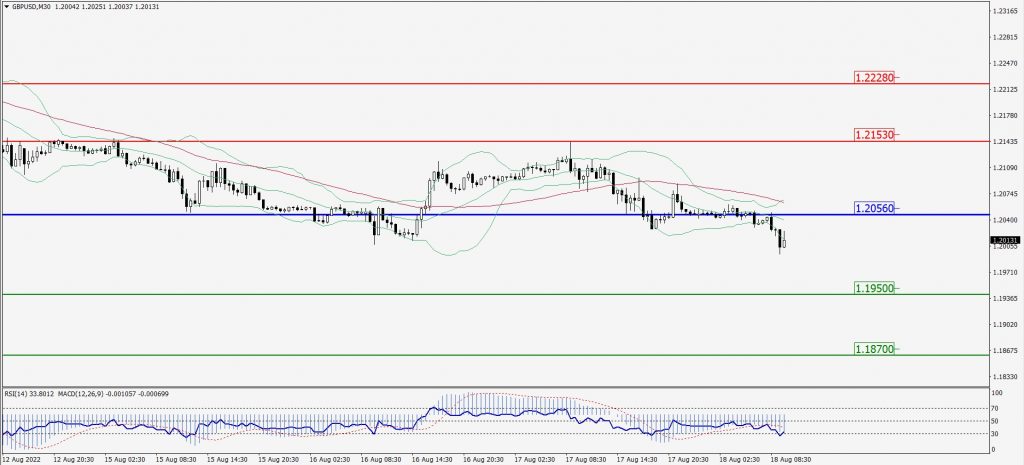
Green Lines Indicate Resistance Levels – Red Lines Indicate Support Levels
Light Blue is a Pivot Point – Black represents the price when the report was produced
USD/JPY Intraday: Trend on the upside
Our pivot point is at 135.210
Preferable Price Action: Buy position above pivot with the target at 136.190 and 136.900 in extension.
Alternative Price Action: The downside breakout of the pivot would call for 134.260 and 133.530.
Comment: MACD is positive territory and Pairs above its 20MA & 55MA.
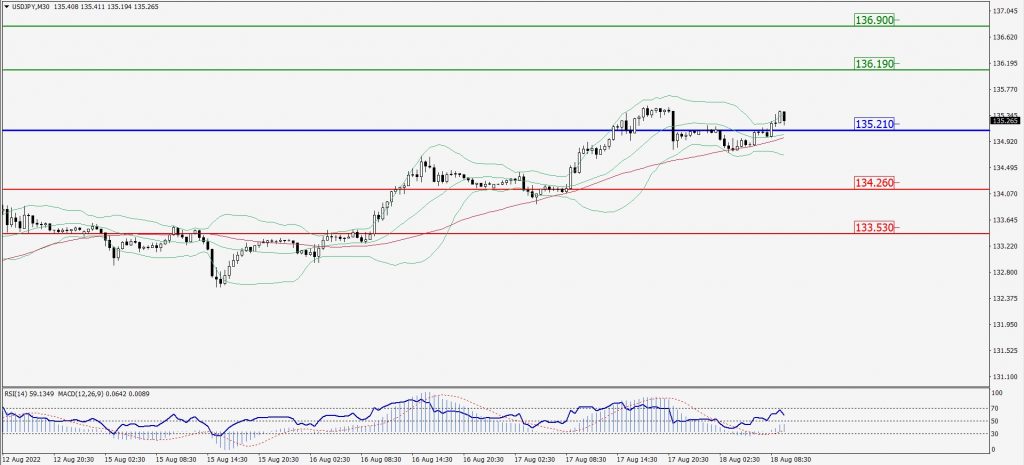
Green Lines Indicate Resistance Levels – Red Lines Indicate Support Levels
Light Blue is a Pivot Point – Black represents the price when the report was produced
AUD/USD Intraday: Trend on the downside
Our pivot point is at 0.69530
Preferable Price Action: Sell Positions below pivot with targets at 0.68770 & 0.68150 in extension.
Alternative Price Action: Above pivot looks for a further upside with 0.70250 & 0.70900 as targets.
Comment: RSI below 50 levels and Pairs below its 20MA & 55MA.
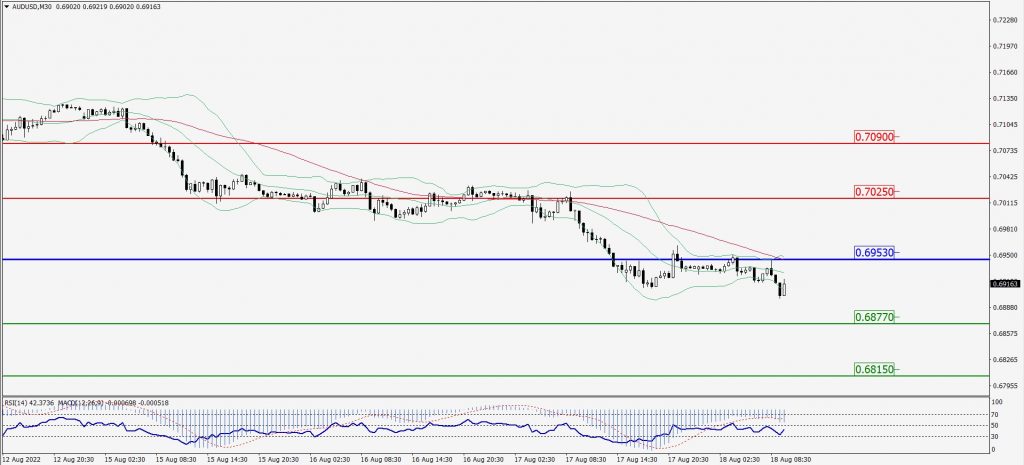
Green Lines Indicate Resistance Levels – Red Lines Indicate Support Levels
Light Blue is a Pivot Point – Black represents the price when the report was produced
CRUDEOIL Intraday: In a consolidation zone
Our pivot point is at 87.07
Preferable Price Action: Above pivots buy oil with 89.65 & 91.53 as targets.
Alternative Price Action: Sell crude below pivot with targets at 84.93 and 83.28 in extension.
Comment: MACD is in the flat territory and Pairs above 55MA.
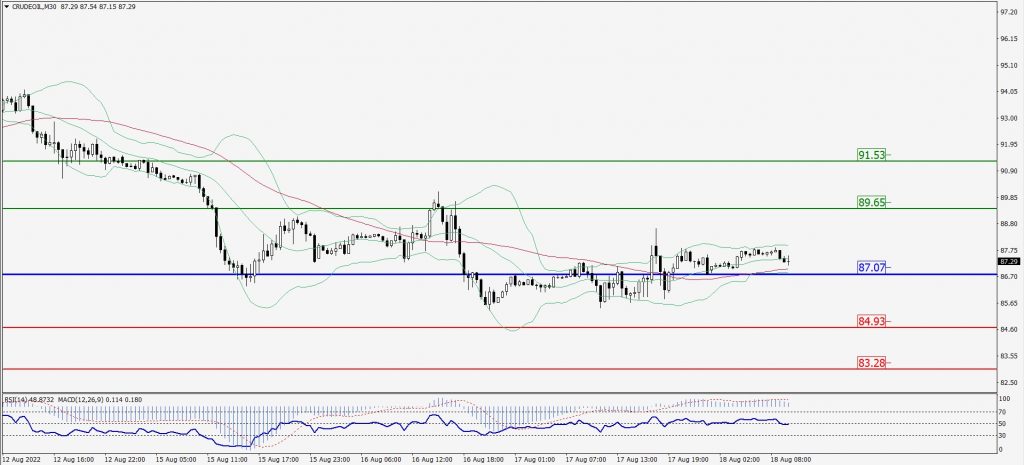
Green Lines Indicate Resistance Levels – Red Lines Indicate Support Levels
Light Blue is a Pivot Point – Black represents the price when the report was produced
XAU/USD Intraday: Resistance level at 1769.60
Our pivot point is 1769.60
Preferable Price Action: Further downside to 1753.30 and 1742.50
Alternative Price Action: If the price gives an upside breakout of a pivot, then the price extends to 1783.50 and 1795.50.
Comment: MACD is negative territory and Pairs below its 20MA & 55MA.
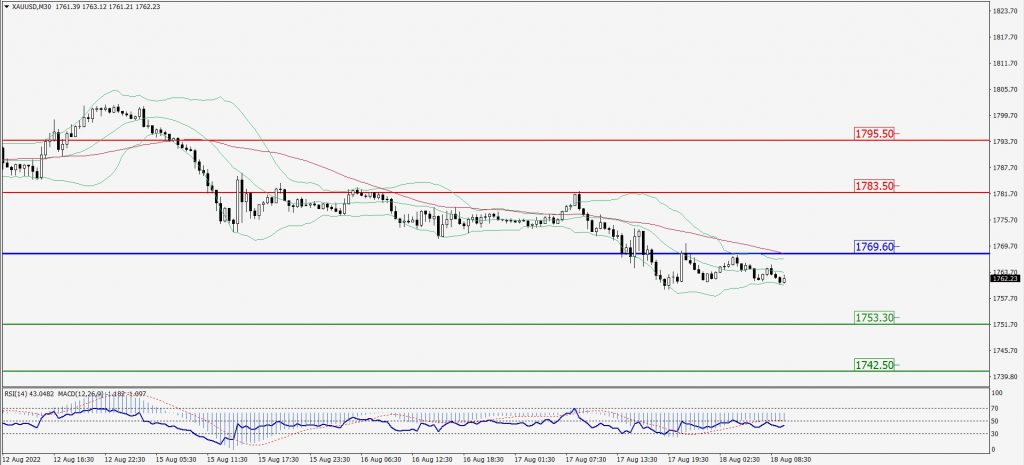
Green Lines Indicate Resistance Levels – Red Lines Indicate Support Levels
Light Blue is a Pivot Point – Black represents the price when the report was produced
Dow Jones Intraday: Trend on the downside
Our pivot point is 34,013.00
Preferable Price Action: Take sell positions below pivot with targets at 33,610.00 & 33,364.00.
Alternative Price Action: Above 34,013.00 looks for further upside to 34,362.00 & 34,642.00.
Comment: RSI below 50 levels and Pairs below its 20MA & 55MA.
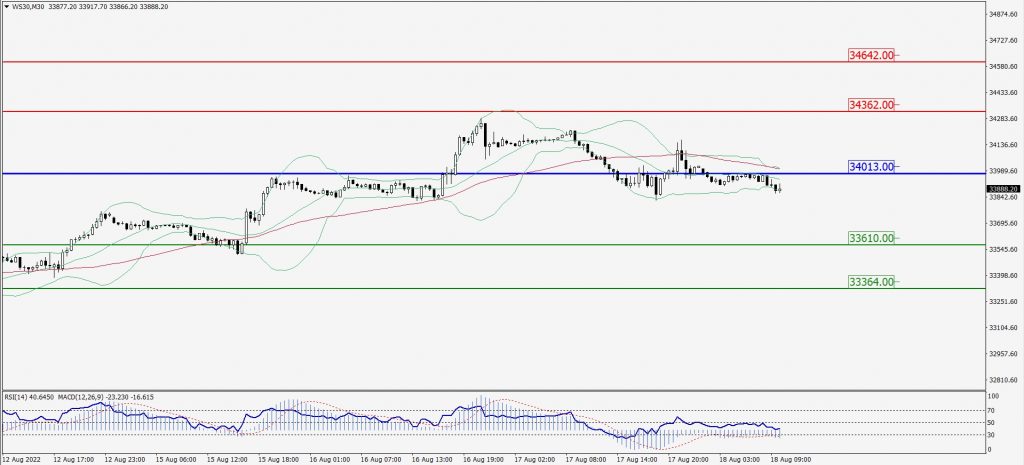
Green Lines Indicate Resistance Levels – Red Lines Indicate Support Levels
Light Blue is a Pivot Point – Black represents the price when the report was produced