Market Wrap: Stocks, Bonds, Commodities
US stocks ended higher Thursday as an upbeat sales forecast from Cisco Systems helped to lift the technology sector, while data showed the economy remained relatively strong.
The Dow Jones Industrial Average rose 18.72 points to 33,999.04, the S&P 500 gain 9.70 points to 4,283.74 and the Nasdaq Composite add 27.22 points to 12,965.34.
MSCI’s index of Asia-Pacific stocks outside Japan is drop 0.44% to 643.88 levels. Australian index higher 0.02% to 7,114.50. Japanese Nikkei Index drop 0.04% to 28,930.33.
European stocks were negative on Friday, with the Stoxx Europe 50 Index fell 0.86% to 3,744.75, Germany’s DAX decline 0.93% to 13,568.71, and France’s CAC drop 0.68% to 6,512.56, and U.K.’s FTSE 100 sliped 0.27% to 7,522.05.
Benchmark 10-year U.S. Treasury fell as demand for safe assets ascend again, today 10-year bond yields a positive 1.80% to 2.9320.
Oil prices edged higher in early trade on Friday, extending a rally into the third day, as investors weighed hopes for strong fuel demand after a larger-than-expected drawdown in U.S. crude stocks, brushing off worries about a global economic slowdown.
Spot Brent crude oil down 1.34% to $95.29 per barrel. US West Texas Intermediate crude is down 1.34% to $89.26 a barrel.
The yellow metal gold is decline 0.22% to 1,767.20 dollars per ounce.
Market Wrap: Forex
The U.S. dollar rose to a new one-month high in early European trade as Federal Reserve policymakers pointed to further aggressive interest rates ahead in the battle to tame soaring inflation.
Today, the U.S. dollar index measures the Greenback against a trade-weighted basket of six major currencies, which is rose 0.19% to 107.608.
The Euro US Dollar (EUR/USD) is a widely traded pair that is down 0.04% today. This left the pair trading around $1.00840.
The Japanese yen was positive against the U.S. dollar on Friday as the stock up. Today USD/JPY is asced 0.47% to 136.510 level.
Another commodity-related currency negative against the U.S dollar, AUD/USD lose 0.17% to 0.69060, and NZD/USD down 0.54 to 0.62260 level.
EUR/USD Intraday: Trend on the downside
Our pivot point is at 1.01140
Preferable Price Action: Take sell positions below pivot level with targets at 1.00280 & 0.99660 in extension.
Alternative Price Action: Above pivot looks for a further upside to 1.01950 & 1.02670.
Comment: RSI below 50 levels and Pairs below 55MA.
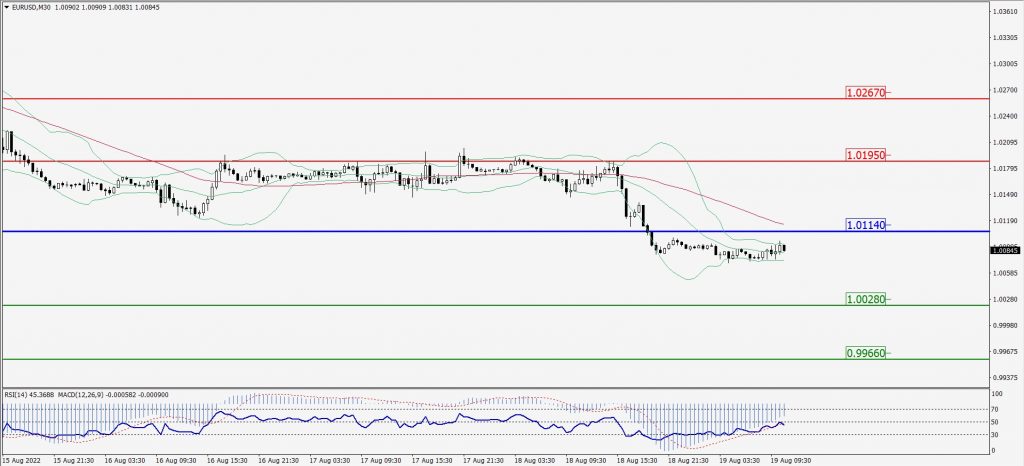
Green Lines Indicate Resistance Levels – Red Lines Indicate Support Levels
Light Blue is a Pivot Point – Black represents the price when the report was produced
GBP/USD Intraday: Trend on the downside
Our pivot point is at 1.19330
Preferable Price Action: Sell positions below pivot with targets at 1.18320 & 1.17680 in extension.
Alternative Price Action: The price above pivot would call for further upside to 1.20220 & 1.20880.
Comment: RSI below 50 levels and Pairs below its 20MA & 55MA.
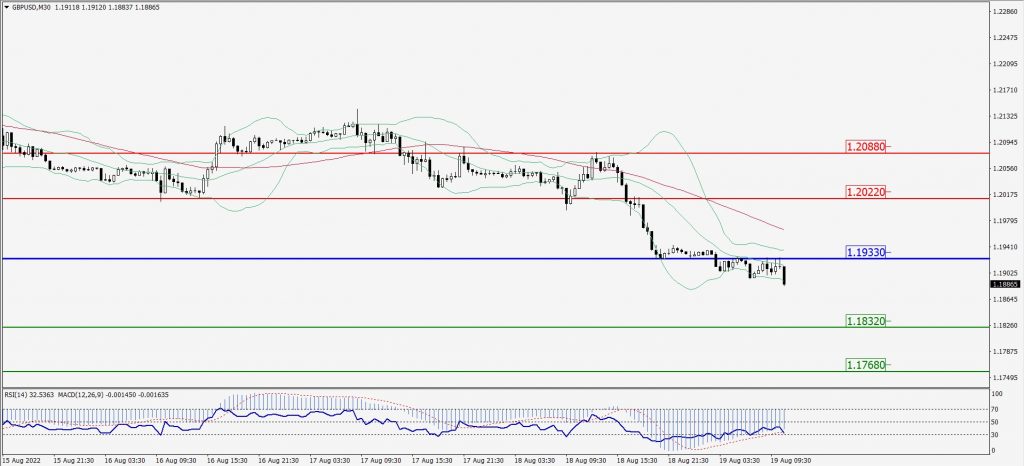
Green Lines Indicate Resistance Levels – Red Lines Indicate Support Levels
Light Blue is a Pivot Point – Black represents the price when the report was produced
USD/JPY Intraday: Major trend on the upside
Our pivot point is at 136.310
Preferable Price Action: Buy position above pivot with the target at 137.560 and 138.290 in extension.
Alternative Price Action: The downside breakout of the pivot would call for 135.300 and 134.610.
Comment: MACD is positive territory and Pairs above its 20MA & 55MA.
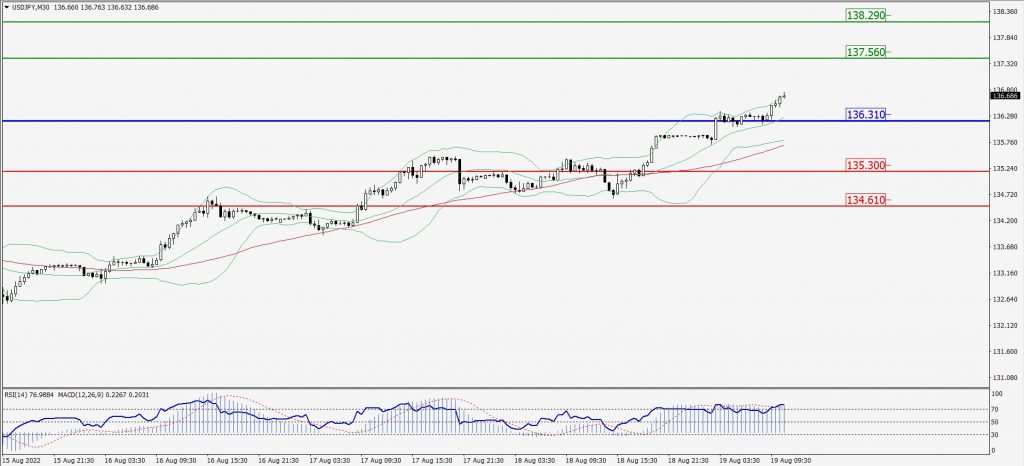
Green Lines Indicate Resistance Levels – Red Lines Indicate Support Levels
Light Blue is a Pivot Point – Black represents the price when the report was produced
AUD/USD Intraday: Resistance level at 0.69280
Our pivot point is at 0.69280
Preferable Price Action: Sell Positions below pivot with targets at 0.68370 & 0.67700 in extension.
Alternative Price Action: Above pivot looks for a further upside with 0.70030 & 0.70680 as targets.
Comment: RSI below 50 levels and Pairs below its 20MA & 55MA.
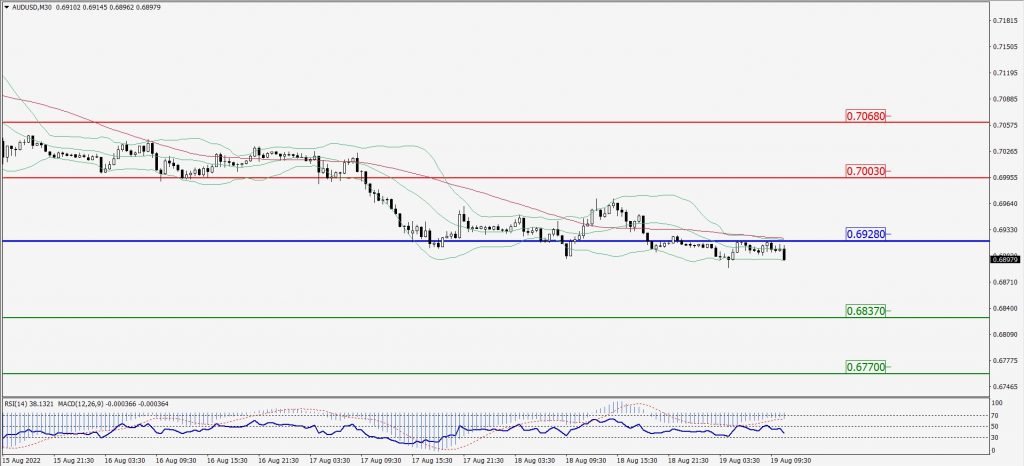
Green Lines Indicate Resistance Levels – Red Lines Indicate Support Levels
Light Blue is a Pivot Point – Black represents the price when the report was produced
CRUDEOIL Intraday: In a consolidation zone
Our pivot point is at 90.43
Preferable Price Action: Below pivots sell oil with 87.94 & 86.11 as targets.
Alternative Price Action: Buy crude above pivot with targets at 92.65 and 94.61 in extension.
Comment: MACD is in the negative territory and Pairs below 20MA.
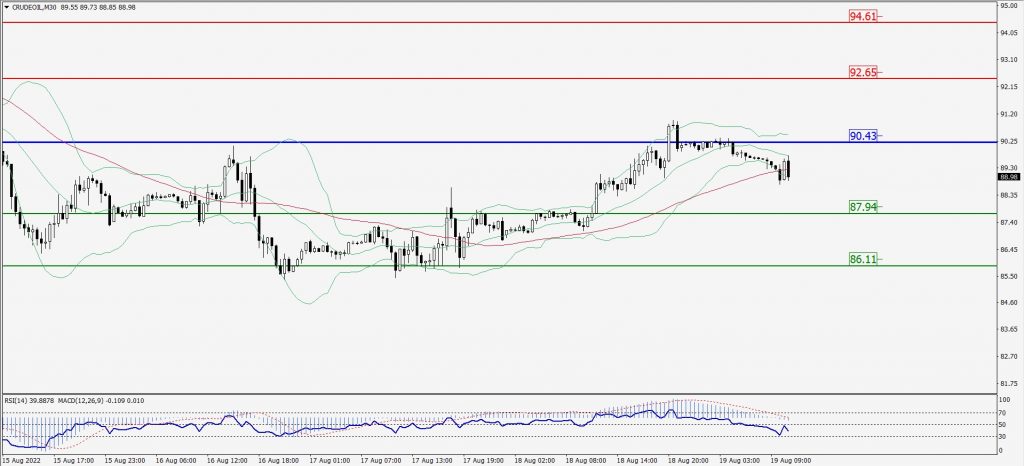
Green Lines Indicate Resistance Levels – Red Lines Indicate Support Levels
Light Blue is a Pivot Point – Black represents the price when the report was produced
XAU/USD Intraday: Resistance level at 1758.30
Our pivot point is 1758.30
Preferable Price Action: Further downside to 1744.90 and 1736.50
Alternative Price Action: If the price gives an upside breakout of a pivot, then the price extends to 1771.10 and 1781.50.
Comment: MACD is negative territory and Pairs below its 20MA & 55MA.
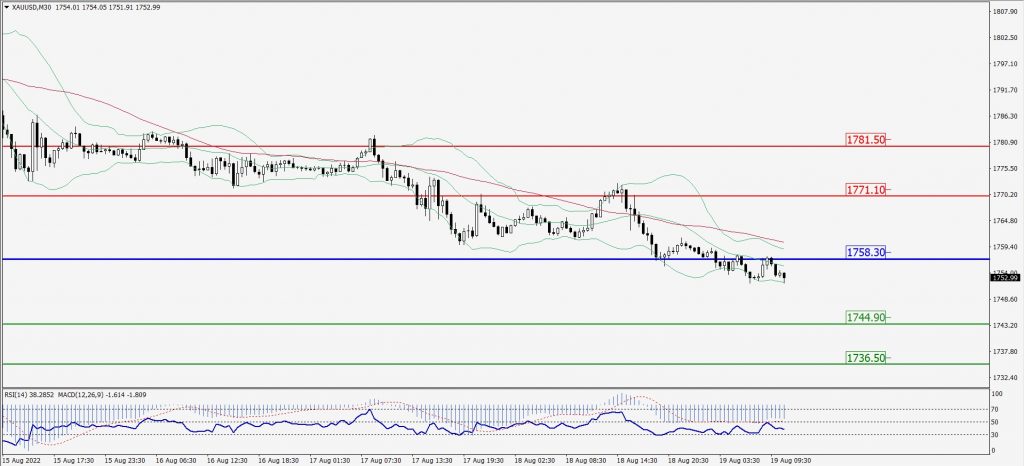
Green Lines Indicate Resistance Levels – Red Lines Indicate Support Levels
Light Blue is a Pivot Point – Black represents the price when the report was produced
Dow Jones Intraday: Trend on the downside
Our pivot point is 33,905.00
Preferable Price Action: Take sell positions below pivot with targets at 33,611.00 & 33,423.00.
Alternative Price Action: Above 33,905.00 looks for further upside to 34,172.00 & 34,359.00.
Comment: RSI below 50 levels and Pairs below its 20MA & 55MA.
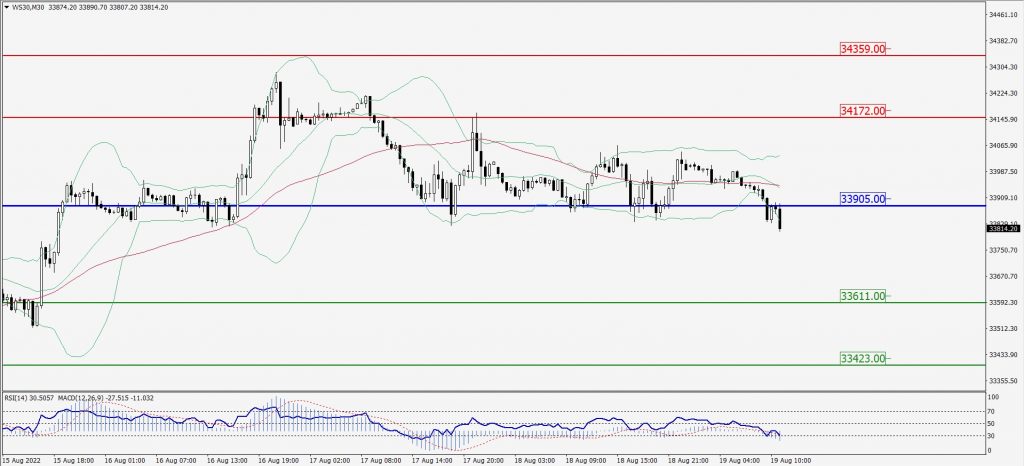
Green Lines Indicate Resistance Levels – Red Lines Indicate Support Levels
Light Blue is a Pivot Point – Black represents the price when the report was produced