Market Wrap: Stocks, Bonds, Commodities
The Dow and S&P 500 rose on Tuesday as stronger-than-expected results and outlooks from Walmart and Home Depot bolstered views on the health of consumers, while technology shares declined and weighed on the Nasdaq.
The Dow Jones Industrial Average rose 239.57 points to 34,152.01, the S&P 500 gain 8.06 points to 4,305.20 and the Nasdaq Composite subtract 25.50 points to 13,102.55.
MSCI’s index of Asia-Pacific stocks outside Japan is ascend 0.32% to 651.46 levels. Australian index higher 0.31% to 7,127.70. Japanese Nikkei Index ascend 1.23% to 29,222.77.
European stocks were nnegative on Wednesday, with the Stoxx Europe 50 Index fell 0.13% to 3,800.25, Germany’s DAX decline 0.18% to 13,884.44, and France’s CAC drop 0.13% to 6,584.15, and U.K.’s FTSE 100 surge 0.02% to 7,534.20.
Benchmark 10-year U.S. Treasury fell as demand for safe assets ascend again, today 10-year bond yields a positive 1.67% to 2.8710.
Oil prices fell over 1 percent on Tuesday in volatile trading as economic data spurred concerns about a potential global recession, while the market awaited clarity on talks to revive a deal that could allow more Iranian oil exports.
Spot Brent crude oil down 0.34% to $92.05 per barrel. US West Texas Intermediate crude is down 0.13% to $86.42 a barrel.
The yellow metal gold is decline 0.18% to 1,786.65 dollars per ounce.
Market Wrap: Forex
The U.S. dollar stabilized in early European trade Wednesday ahead of the release of the minutes from the last Federal Reserve meeting, while sterling edged higher after the latest jump in inflation.
Today, the U.S. dollar index measures the Greenback against a trade-weighted basket of six major currencies, which is rose 0.22% to 106.625.
The Euro US Dollar (EUR/USD) is a widely traded pair that is down 0.17% today. This left the pair trading around $1.01540.
The Japanese yen was positive against the U.S. dollar on Wednesday as the stock up. Today USD/JPY is asced 0.49% to 134.860 level.
Another commodity-related currency negative against the U.S dollar, AUD/USD lose 0.76% to 0.69680, and NZD/USD down 0.56 to 0.63090 level.
EUR/USD Intraday: Resistance level at 1.01940
Our pivot point is at 1.01940
Preferable Price Action: Take sell positions below pivot level with targets at 1.01050 & 1.00440 in extension.
Alternative Price Action: Above pivot looks for a further upside to 1.02740 & 1.03420.
Comment: RSI below 50 levels and Pairs below 20MA.
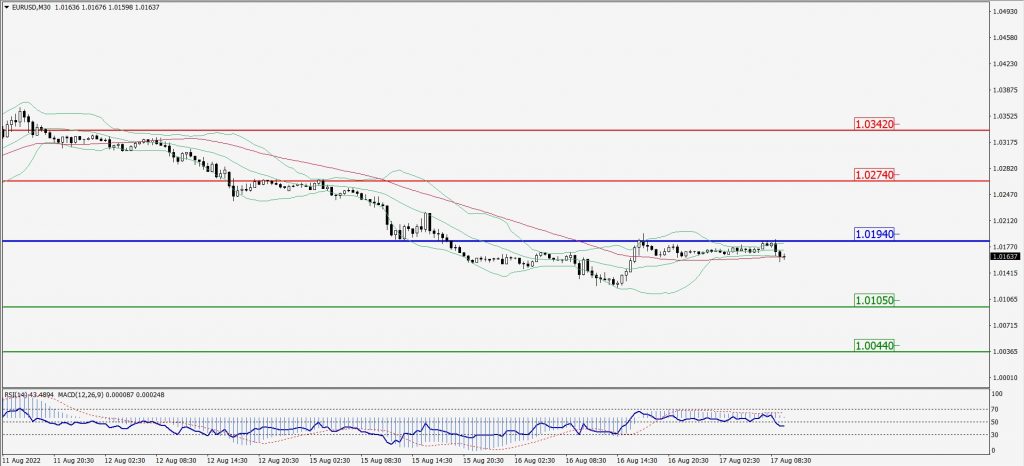
Green Lines Indicate Resistance Levels – Red Lines Indicate Support Levels
Light Blue is a Pivot Point – Black represents the price when the report was produced
GBP/USD Intraday: Trend on the downside
Our pivot point is at 1.21310
Preferable Price Action: Sell positions below pivot with targets at 1.20260 & 1.19590 in extension.
Alternative Price Action: The price above pivot would call for further upside to 1.22170 & 1.22860.
Comment: RSI below 50 levels and Pairs below 20MA.
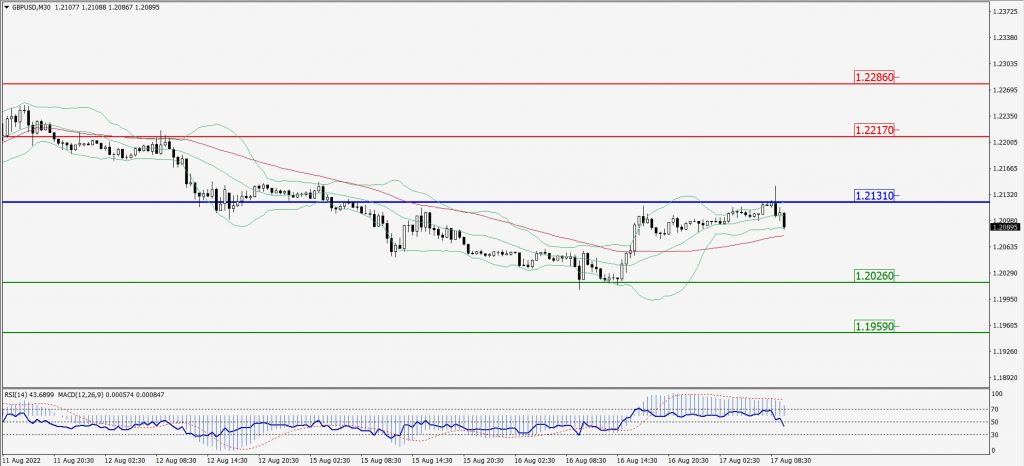
Green Lines Indicate Resistance Levels – Red Lines Indicate Support Levels
Light Blue is a Pivot Point – Black represents the price when the report was produced
USD/JPY Intraday: Trend on the upside
Our pivot point is at 134.270
Preferable Price Action: Buy position above pivot with the target at 135.430 and 136.300 in extension.
Alternative Price Action: The downside breakout of the pivot would call for 133.300 and 132.550.
Comment: MACD is positive territory and Pairs above its 20MA & 55MA.
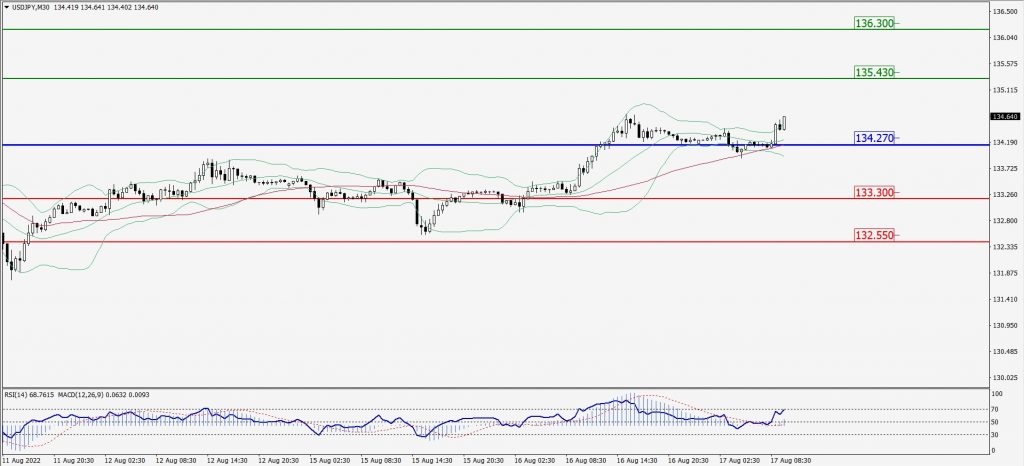
Green Lines Indicate Resistance Levels – Red Lines Indicate Support Levels
Light Blue is a Pivot Point – Black represents the price when the report was produced
AUD/USD Intraday: Trend on the downside
Our pivot point is at 0.70080
Preferable Price Action: Sell Positions below pivot with targets at 0.69350 & 0.68860 in extension.
Alternative Price Action: Above pivot looks for a further upside with 0.70740 & 0.71320 as targets.
Comment: RSI below 50 levels and Pairs below its 20MA & 55MA.
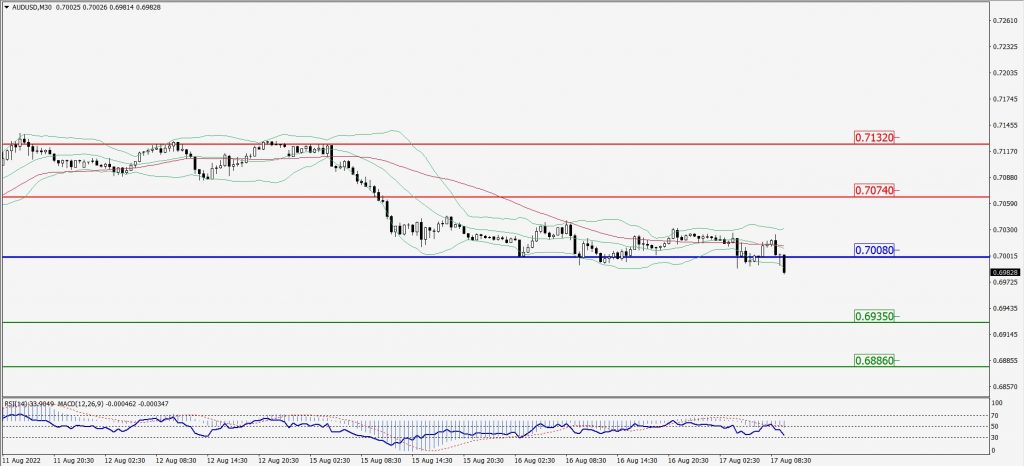
Green Lines Indicate Resistance Levels – Red Lines Indicate Support Levels
Light Blue is a Pivot Point – Black represents the price when the report was produced
CRUDEOIL Intraday: In a consolidation zone
Our pivot point is at 87.58
Preferable Price Action: Below pivots sell oil with 84.87 & 82.78 as targets.
Alternative Price Action: Buy crude above pivot with targets at 89.81 and 91.67 in extension.
Comment: MACD is in the negative territory and Pairs below 55MA.
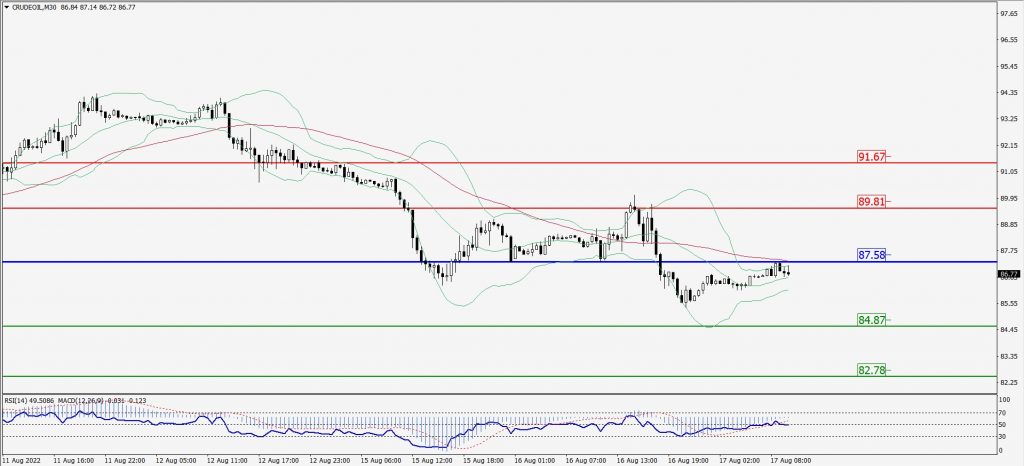
Green Lines Indicate Resistance Levels – Red Lines Indicate Support Levels
Light Blue is a Pivot Point – Black represents the price when the report was produced
XAU/USD Intraday: Resistance level at 1778.60
Our pivot point is 1778.60
Preferable Price Action: Further downside to 1765.60 and 1756.00
Alternative Price Action: If the price gives an upside breakout of a pivot, then the price extends to 1791.20 and 1801.10.
Comment: MACD is negative territory and Pairs below its 20MA & 55MA.
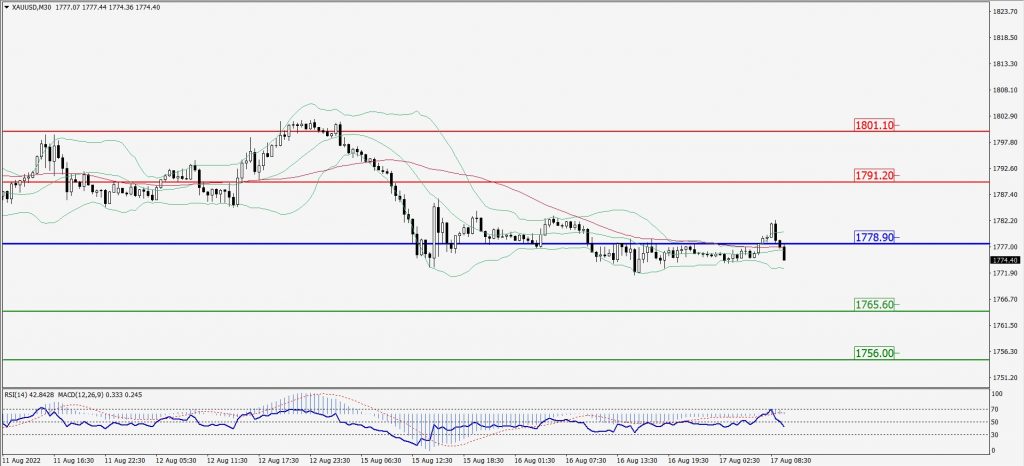
Green Lines Indicate Resistance Levels – Red Lines Indicate Support Levels
Light Blue is a Pivot Point – Black represents the price when the report was produced
Dow Jones Intraday: Trend on the downside
Our pivot point is 34,258.00
Preferable Price Action: Take sell positions below pivot with targets at 33,922.00 & 33,664.00.
Alternative Price Action: Above 34,258.00 looks for further upside to 34,580.00 & 34,822.00.
Comment: RSI below 50 levels and Pairs below 20MA.
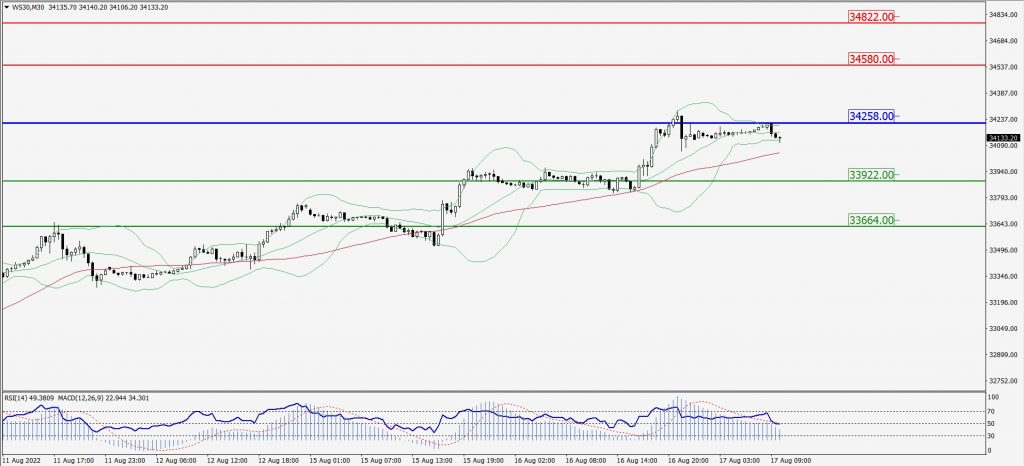
Green Lines Indicate Resistance Levels – Red Lines Indicate Support Levels
Light Blue is a Pivot Point – Black represents the price when the report was produced