Market Wrap: Stocks, Bonds, Commodities
US stocks rose on Monday with mega-cap growth shares, extending the market’s recent rally amid investor optimism the Federal Reserve can achieve a soft landing for the economy.
The Dow Jones Industrial Average rose 151.39 points to 33,912.44, the S&P 500 gain 16.99 points to 4,297.14 and the Nasdaq Composite add 80.87 points to 13,128.05.
MSCI’s index of Asia-Pacific stocks outside Japan is drop 0.21% to 649.42 levels. Australian index higher 0.58% to 7,105.40. Japanese Nikkei Index drop 0.02% to 28,868.91.
European stocks were positive on Tuesday, with the Stoxx Europe 50 Index rose 0.39% to 3,804.95, Germany’s DAX advance 0.44% to 13,878.75, and France’s CAC ascend 0.35% to 6,592.83, and U.K.’s FTSE 100 surged 0.32% to 7,534.28.
Benchmark 10-year U.S. Treasury fell as demand for safe assets ascend again, today 10-year bond yields a positive 0.28% to 2.7990.
Oil prices fell on Tuesday as bleak economic data from top crude buyer China renewed fears of a global recession.
Spot Brent crude oil down 1.52% to $93.62 per barrel. US West Texas Intermediate crude is down 1.36% to $88.08 a barrel.
The yellow metal gold is decline 0.45% to 1,789.90 dollars per ounce.
Market Wrap: Forex
The U.S. dollar edged higher in early European trade Tuesday, remaining near a one-week high as global recession fears prompted demand for the safe haven currency.
Today, the U.S. dollar index measures the Greenback against a trade-weighted basket of six major currencies, which is rose 0.08% to 106.517.
The Euro US Dollar (EUR/USD) is a widely traded pair that is down 0.06% today. This left the pair trading around $1.01540.
The Japanese yen was positive against the U.S. dollar on Tuesday as the stock up. Today USD/JPY is asced 0.31% to 133.740 level.
Another commodity-related currency negative against the U.S dollar, AUD/USD lose 0.13% to 0.70130, and NZD/USD down 0.31 to 0.63430 level.
EUR/USD Intraday: Resistance level at 1.01750
Our pivot point is at 1.07500
Preferable Price Action: Take sell positions below pivot level with targets at 1.00900 & 1.00280 in extension.
Alternative Price Action: Above pivot looks for a further upside to 1.02400 & 1.03020.
Comment: RSI below 50 levels and Pairs below its 20MA & 55MA.
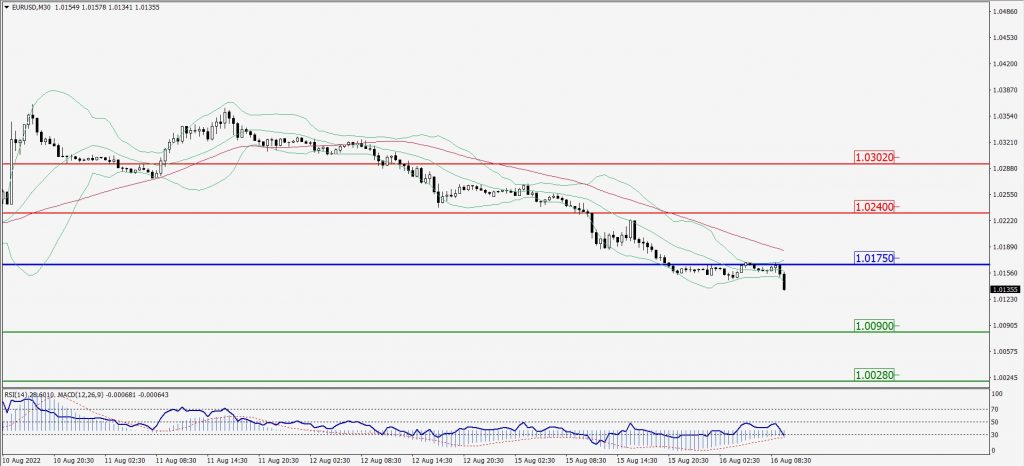
Green Lines Indicate Resistance Levels – Red Lines Indicate Support Levels
Light Blue is a Pivot Point – Black represents the price when the report was produced
GBP/USD Intraday: Trend on the downside
Our pivot point is at 1.20630
Preferable Price Action: Sell positions below pivot with targets at 1.19600 & 1.18960 in extension.
Alternative Price Action: The price above pivot would call for further upside to 1.21530 & 1.22290.
Comment: RSI below 50 levels and Pairs below its 20MA & 55MA.
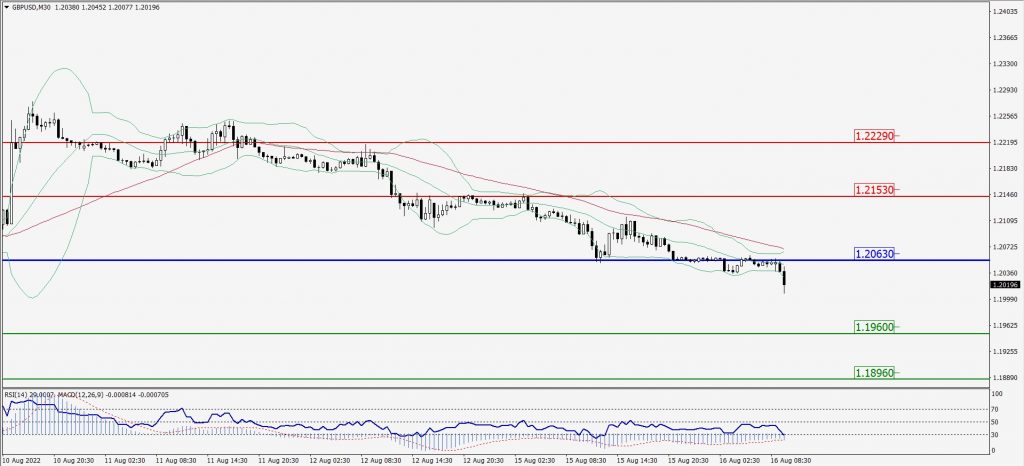
Green Lines Indicate Resistance Levels – Red Lines Indicate Support Levels
Light Blue is a Pivot Point – Black represents the price when the report was produced
USD/JPY Intraday: Trend on the upside
Our pivot point is at 133.590
Preferable Price Action: Buy position above pivot with the target at 134.380 and 135.000 in extension.
Alternative Price Action: The downside breakout of the pivot would call for 132.920 and 132.420.
Comment: MACD is positive territory and Pairs above its 20MA & 55MA.
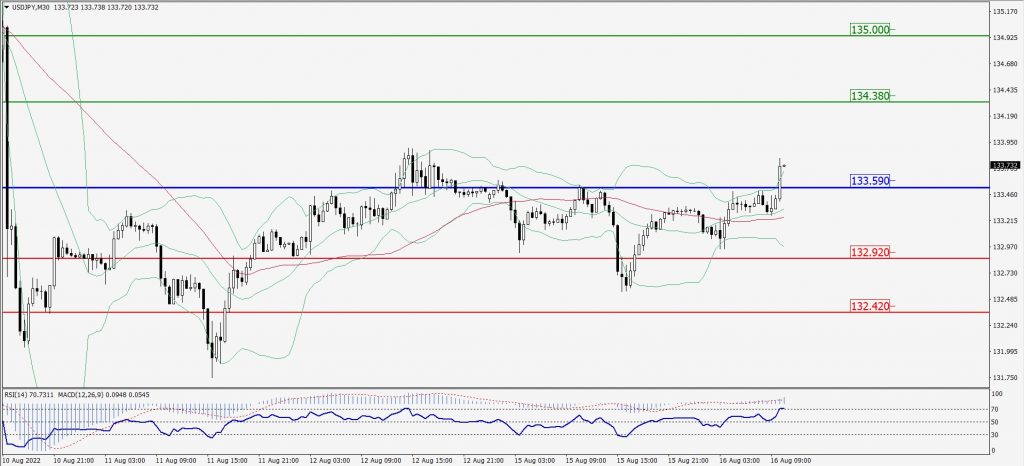
Green Lines Indicate Resistance Levels – Red Lines Indicate Support Levels
Light Blue is a Pivot Point – Black represents the price when the report was produced
AUD/USD Intraday: Trend on the downside
Our pivot point is at 0.70360
Preferable Price Action: Sell Positions below pivot with targets at 0.69590 & 0.69140 in extension.
Alternative Price Action: Above pivot looks for a further upside with 0.71040 & 0.71530 as targets.
Comment: RSI below 50 levels and Pairs below its 20MA & 55MA.
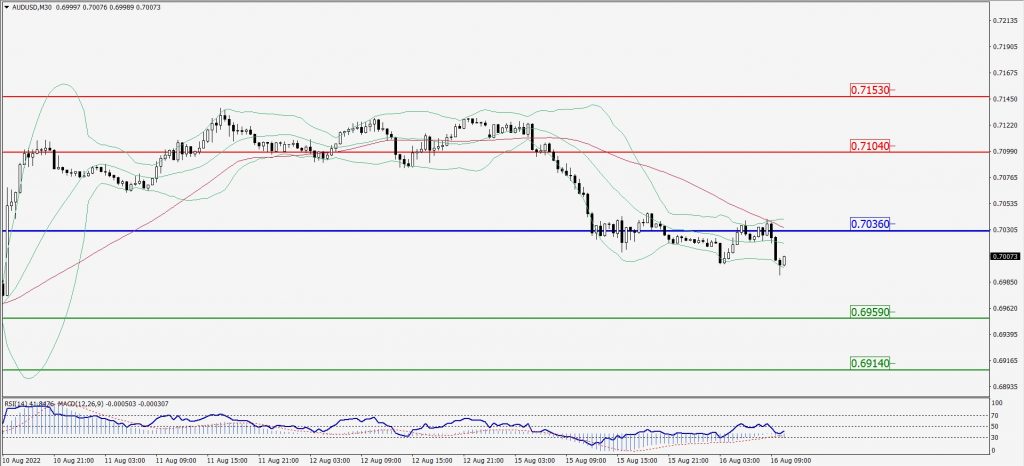
Green Lines Indicate Resistance Levels – Red Lines Indicate Support Levels
Light Blue is a Pivot Point – Black represents the price when the report was produced
CRUDEOIL Intraday: Support level at 88.24
Our pivot point is at 88.24
Preferable Price Action: Above pivots buy oil with 91.37 & 93.86 as targets.
Alternative Price Action: Sell crude below pivot with targets at 85.20 and 93.86 in extension.
Comment: MACD is in the positive territory and Pairs above 20MA.
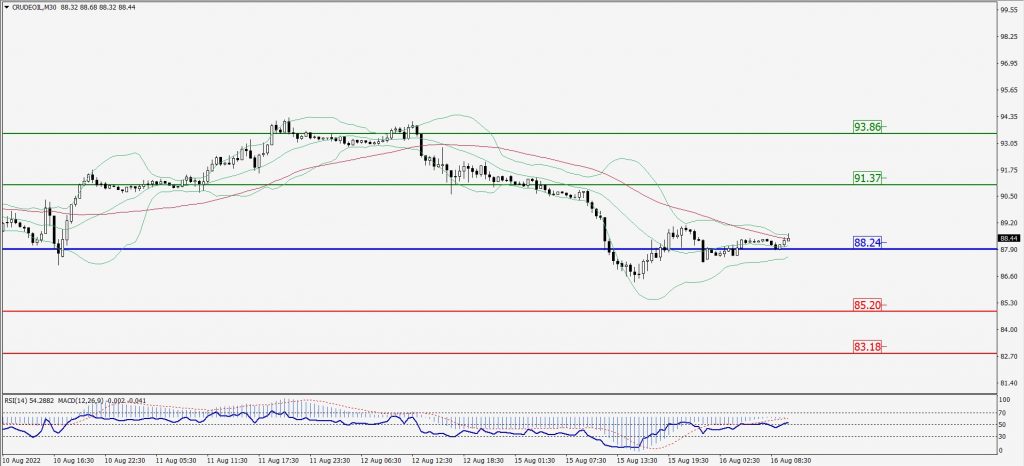
Green Lines Indicate Resistance Levels – Red Lines Indicate Support Levels
Light Blue is a Pivot Point – Black represents the price when the report was produced
XAU/USD Intraday: Resistance level at 1783.60
Our pivot point is 1783.60
Preferable Price Action: Further downside to 1767.50 and 1757.00
Alternative Price Action: If the price gives an upside breakout of a pivot, then the price extends to 1797.60 and 1809.10.
Comment: MACD is negative territory and Pairs below its 20MA & 55MA.
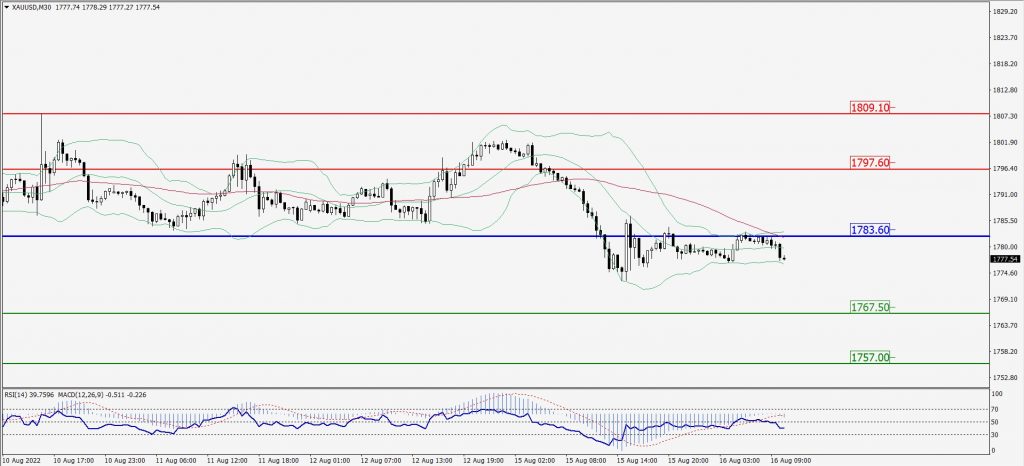
Green Lines Indicate Resistance Levels – Red Lines Indicate Support Levels
Light Blue is a Pivot Point – Black represents the price when the report was produced
Dow Jones Intraday: Trend on the upside
Our pivot point is 33,838.00
Preferable Price Action: Take buy positions above pivot with targets at 34,266.00 & 34,550.00.
Alternative Price Action: Below 33,838.00 looks for further downside to 33,501.00 & 33,238.00.
Comment: RSI above 50 levels and Pairs above 55MA.
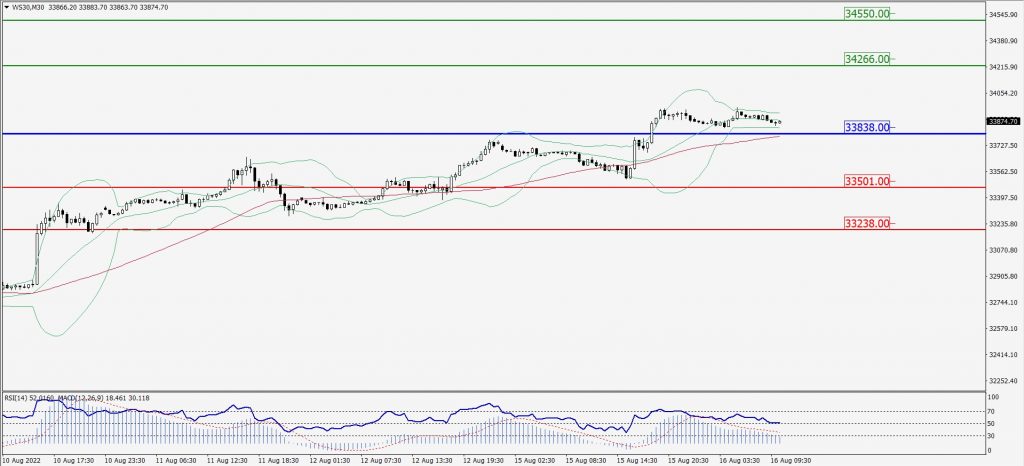
Green Lines Indicate Resistance Levels – Red Lines Indicate Support Levels
Light Blue is a Pivot Point – Black represents the price when the report was produced