Market Wrap: Stocks, Bonds, Commodities
Scandinavian airline SAS kept its bid for survival aloft at the weekend by securing bridge financing through bankruptcy protection proceedings and sent its shares 9% higher on Monday.
The Dow Jones Industrial Average rose 424.38 points to 33,761.05, the S&P 500 gain 72.88 points to 4,280.15 and the Nasdaq Composite add 267.27 points to 13,047.19.
MSCI’s index of Asia-Pacific stocks outside Japan is drop 0.29% to 650.13 levels. Australian index higher 0.45% to 7,064.30. Japanese Nikkei Index ascend 1.14% to 28,871.78.
European stocks were positive on Monday, with the Stoxx Europe 50 Index rose 0.15% to 3,782.55, Germany’s DAX advance 0.03% to 13,798.75, and France’s CAC ascend 0.18% to 6,565.47, and U.K.’s FTSE 100 surged 0.10% to 7,508.40.
Benchmark 10-year U.S. Treasury fell as demand for safe assets ascend again, today 10-year bond yields a negative 0.94% to 2.8220.
Oil prices dropped for a second session on Monday as weak China economic data triggered concerns about demand at the world’s largest crude importer while the head of the world’s top exporter, Saudi Aramco, said it was ready to ramp up output.
Spot Brent crude oil down 3.57% to $94.71 per barrel. US West Texas Intermediate crude is down 3.63% to $88.70 a barrel.
The yellow metal gold is decline 0.98% to 1,797.65 dollars per ounce.
Market Wrap: Forex
The safe-haven U.S. dollar rose on Monday after a new batch of disappointing data from China bolstered global recession worries, while the yuan weakened following a People’s Bank of China surprise rate cut.
Today, the U.S. dollar index measures the Greenback against a trade-weighted basket of six major currencies, which is rose 0.60% to 106.145.
The Euro US Dollar (EUR/USD) is a widely traded pair that is down 0.61% today. This left the pair trading around $1.01950.
The Japanese yen was positive against the U.S. dollar on Monday as the stock up. Today USD/JPY is drop 0.13% to 133.310 level.
Another commodity-related currency negative against the U.S dollar, AUD/USD lose 1.32% to 0.70270, and NZD/USD down 1.39 to 0.63630 level.
EUR/USD Intraday: Trend on the downside
Our pivot point is at 1.02390
Preferable Price Action: Take sell positions below pivot level with targets at 1.01820 & 1.01340 in extension.
Alternative Price Action: Above pivot looks for a further upside to 1.02930 & 1.03400.
Comment: RSI below 50 levels and Pairs below its 20MA & 55MA.

Green Lines Indicate Resistance Levels – Red Lines Indicate Support Levels
Light Blue is a Pivot Point – Black represents the price when the report was produced
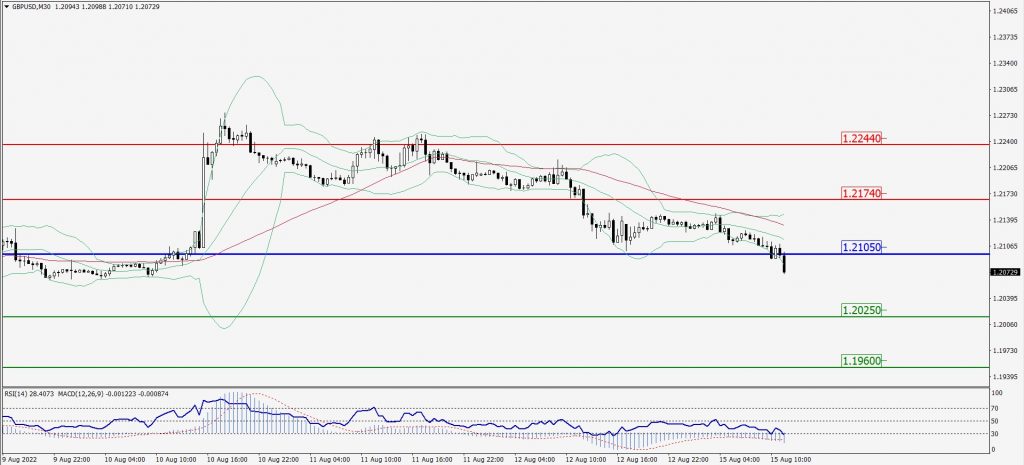
GBP/USD Intraday: Trend on the downside
Our pivot point is at 1.21050
Preferable Price Action: Sell positions below pivot with targets at 1.20250 & 1.19600 in extension.
Alternative Price Action: The price below pivot would call for further upside to 1.21740 & 1.22440.
Comment: RSI below 50 levels and Pairs below its 20MA & 55MA.
Green Lines Indicate Resistance Levels – Red Lines Indicate Support Levels
Light Blue is a Pivot Point – Black represents the price when the report was produced
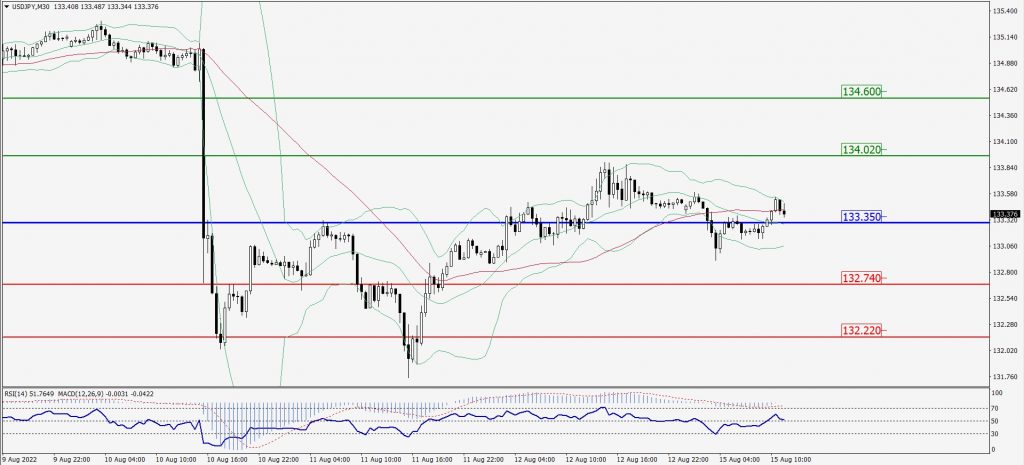
USD/JPY Intraday: Trend on the upside
Our pivot point is at 133.350
Preferable Price Action: Buy position above pivot with the target at 134.020 and 134.600 in extension.
Alternative Price Action: The downside breakout of the pivot would call for 132.740 and 132.220.
Comment: MACD is positive territory and Pairs above 20MA.
Green Lines Indicate Resistance Levels – Red Lines Indicate Support Levels
Light Blue is a Pivot Point – Black represents the price when the report was produced
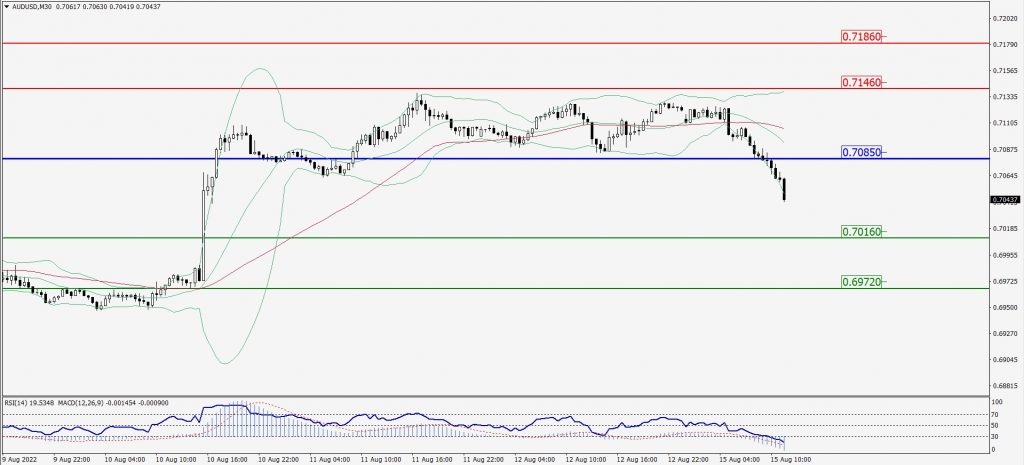
AUD/USD Intraday: Trend on the downside
Our pivot point is at 0.70850
Preferable Price Action: Sell Positions below pivot with targets at 0.70160 & 0.69720 in extension.
Alternative Price Action: Above pivot looks for a further upside with 0.71460 & 0.71860 as targets.
Comment: RSI below 50 levels and Pairs below its 20MA & 55MA.
Green Lines Indicate Resistance Levels – Red Lines Indicate Support Levels
Light Blue is a Pivot Point – Black represents the price when the report was produced
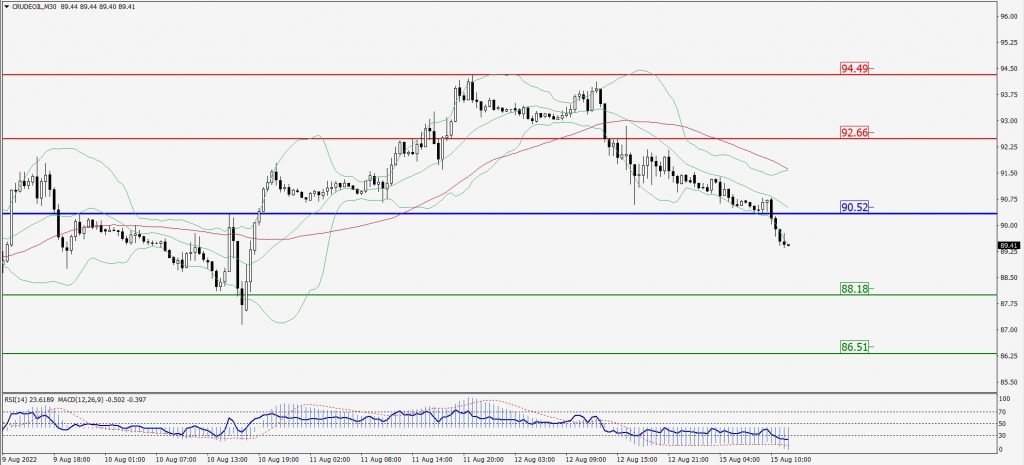
CRUDEOIL Intraday: Major trend on the downside
Our pivot point is at 90.52
Preferable Price Action: Below pivots sell oil with 88.18 & 86.51 as targets.
Alternative Price Action: Buy crude above pivot with targets at 92.66 and 94.49 in extension.
Comment: MACD is in the negative territory and Pairs below its 20MA & 55MA.
Green Lines Indicate Resistance Levels – Red Lines Indicate Support Levels
Light Blue is a Pivot Point – Black represents the price when the report was produced
XAU/USD Intraday: Resistance level at 1789.60
Our pivot point is 1789.60
Preferable Price Action: Further downside to 1775.40 and 1765.90
Alternative Price Action: If the price gives an upside breakout of a pivot, then the price extends to 1802.50 and 1812.20.
Comment: MACD is negative territory and Pairs below its 20MA & 55MA.
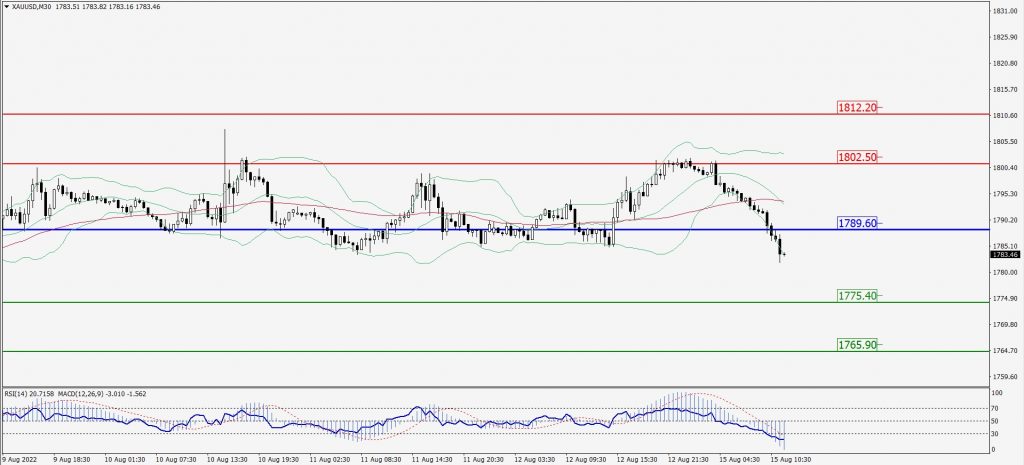
Green Lines Indicate Resistance Levels – Red Lines Indicate Support Levels
Light Blue is a Pivot Point – Black represents the price when the report was produced
Dow Jones Intraday: Resistance level at 33,798.00
Our pivot point is 33,798.00
Preferable Price Action: Take sell positions below pivot with targets at 33,444.00 & 33,181.00.
Alternative Price Action: Above 33,798.00 looks for further upside to 34,187.00 & 34,479.00.
Comment: RSI below 50 levels and Pairs below 20MA.
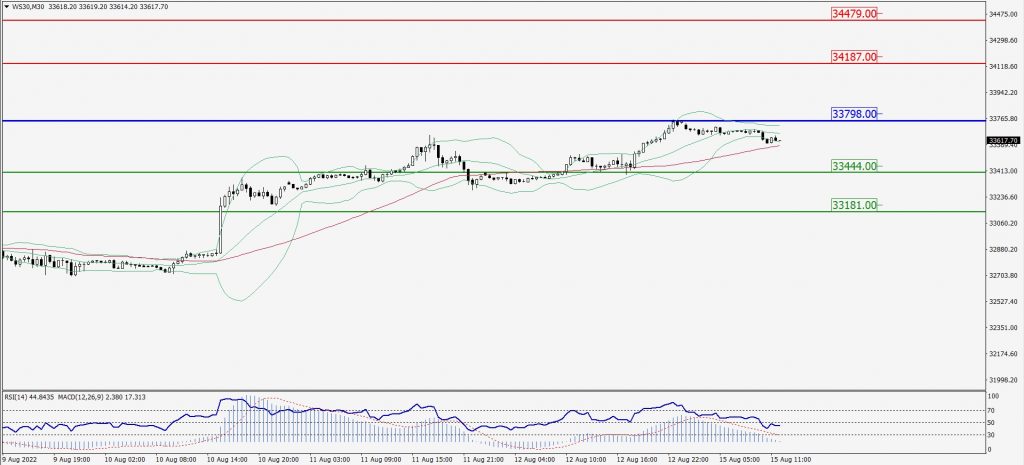
Green Lines Indicate Resistance Levels – Red Lines Indicate Support Levels
Light Blue is a Pivot Point – Black represents the price when the report was produced