Market Wrap: Stocks, Bonds, Commodities
US stocks lost ground on Monday as a lack of catalysts left market participants warily embarking on a week back-end loaded with crucial inflation data and the unofficial beginning to second-quarter earnings season.
The Dow Jones Industrial Average fell 164.31 points to 31,173.84, the S&P 500 lose 44.95 points to 3,854.43 and the Nasdaq Composite subtract 262.71 points to 11,372.60.
MSCI’s index of Asia-Pacific stocks outside Japan is drop 1.52% to 631.65 levels. Australian index higher 0.06% to 6,606.30. Japanese Nikkei Index drop 1.77% to 26,336.66.
European stocks were negative on Tuesday, with the Stoxx Europe 50 Index fell 0.48% to 3,455.15, Germany’s DAX decline 0.60% to 12,755.99, and France’s CAC drop 0.24% to 5,982.14, and U.K.’s FTSE 100 slipped 0.07% to 7,191.05.
Benchmark 10-year U.S. Treasury fell as demand for safe assets ascend again, today 10-year bond yields a negative 2.41% to 2.9190.
Oil prices were little changed on Monday as markets balanced an expected drop in demand due to mass testing for COVID-19 in China against ongoing concerns over tight supply.
Spot Brent crude oil subtracts 1.90% to $105.06 per barrel. US West Texas Intermediate crude is down 2.30% to $101.71 a barrel.
The yellow metal gold is advance 0.12% to 1,733.65 dollars per ounce.
Market Wrap: Forex
The U.S. dollar hit a fresh two-decade peak versus major peers on Tuesday, hoisted by safety bids and expectations of further aggressive rate hikes by the Federal Reserve, while the euro was pinned close to a 20-year low near parity to the greenback.
Today, the U.S. dollar index measures the Greenback against a trade-weighted basket of six major currencies, which is rose 0.45% to 108.315.
The Euro US Dollar (EUR/USD) is a widely traded pair that is down 0.28% today. This left the pair trading around $1.00120.
The Japanese yen was positive against the U.S. dollar on Tuesday as the stock up. Today USD/JPY is drop 0.12% to 137.250 level.
Another commodity-related currency negative against the U.S dollar, AUD/USD lose 0.16% to 0.67200, and NZD/USD down 0.10 to 0.61040 level.
EUR/USD Intraday: Major trend on the downside
Our pivot point is at 1.00550
Preferable Price Action: Take sell positions below pivot level with targets at 1.99380 & 0.98500 in extension.
Alternative Price Action: Above pivot looks for a further upside to 1.01610 & 1.02460.
Comment: RSI below 50 levels and Pair below its 20MA & 55MA.
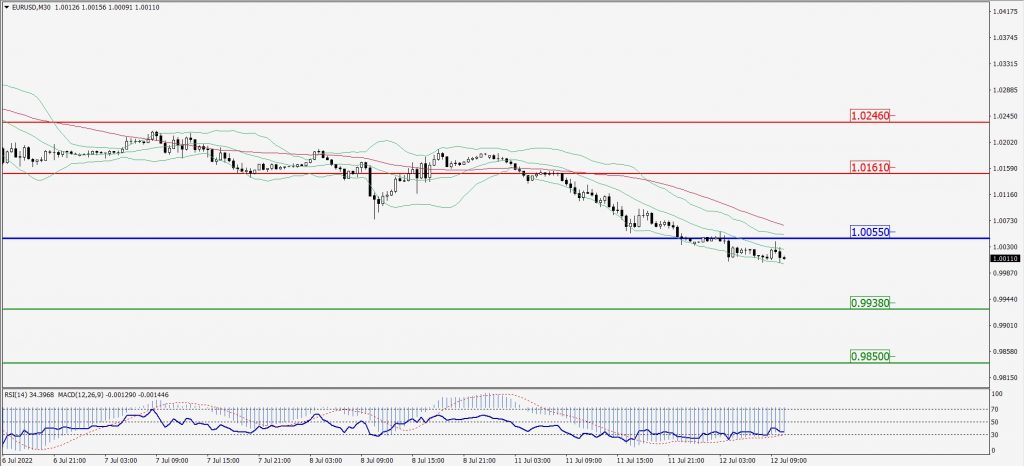
Green Lines Indicate Resistance Levels – Red Lines Indicate Support Levels
Light Blue is a Pivot Point – Black represents the price when the report was produced
GBP/USD Intraday: Trend on the downside
Our pivot point is at 1.18850
Preferable Price Action: Sell positions below pivot with targets at 1.17660 & 1.16860 in extension.
Alternative Price Action: The price above pivot would call for further upside to 1.19820 & 1.20660.
Comment: RSI below 50 levels pair below its 20MA & 55MA.
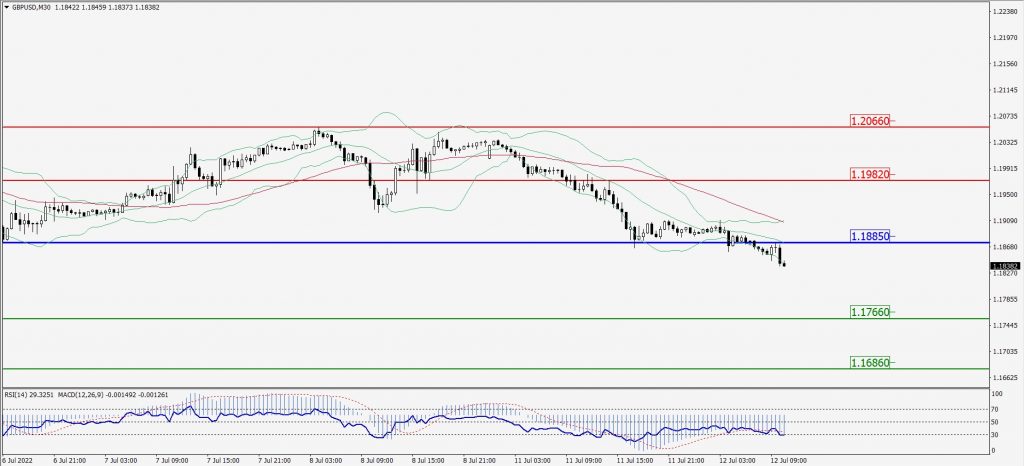
Green Lines Indicate Resistance Levels – Red Lines Indicate Support Levels
Light Blue is a Pivot Point – Black represents the price when the report was produced
USD/JPY Intraday: In a consolidation zone
Our pivot point is at 137.580
Preferable Price Action: Sell position below pivot with the target at 136.700 and 136.080 in extension.
Alternative Price Action: The upside breakout of the pivot would call for 138.460 and 139.190.
Comment: MACD is flat territory.
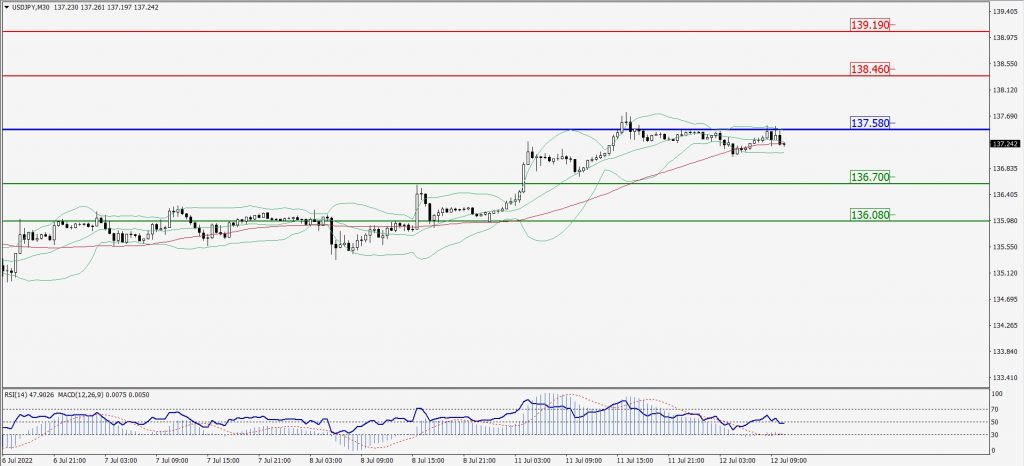
Green Lines Indicate Resistance Levels – Red Lines Indicate Support Levels
Light Blue is a Pivot Point – Black represents the price when the report was produced
AUD/USD Intraday: Resistance level at 0.67410
Our pivot point is at 0.67410
Preferable Price Action: Sell Positions below pivot with targets at 0.66630 & 0.66100 in extension.
Alternative Price Action: Above pivot looks for a further upside with 0.68110 & 0.68690 as targets.
Comment: RSI below 50 levels and Pair below its 20MA & 55MA.
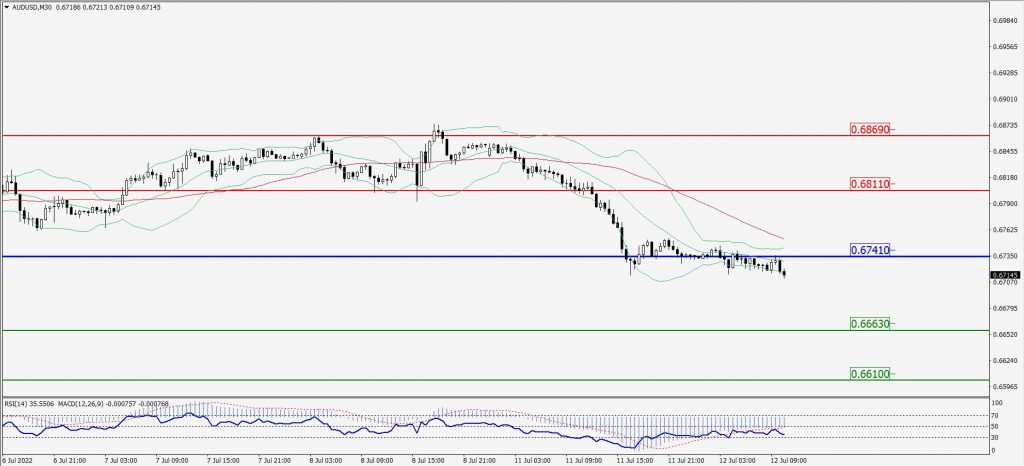
Green Lines Indicate Resistance Levels – Red Lines Indicate Support Levels
Light Blue is a Pivot Point – Black represents the price when the report was produced
CRUDEOIL Intraday: Major resistance level at 100.72
Our pivot point is at 100.72
Preferable Price Action: Below pivots sell oil with 97.61 & 95.00 as targets.
Alternative Price Action: Buy crude above pivot with targets at 104.11 and 106.67 in extension.
Comment: MACD is in the negative territory and Pair below its 20MA & 55MA.
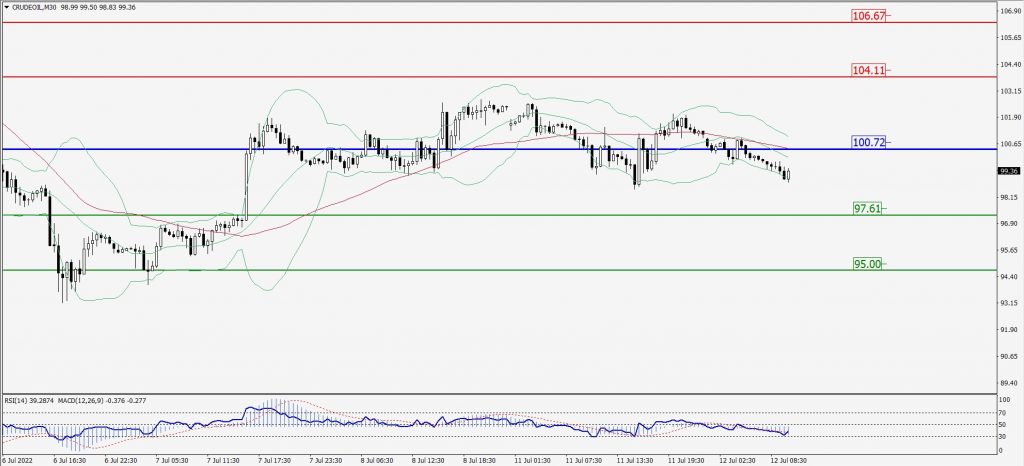
Green Lines Indicate Resistance Levels – Red Lines Indicate Support Levels
Light Blue is a Pivot Point – Black represents the price when the report was produced
XAU/USD Intraday: Trend on the upside
Our pivot point is 1731.30
Preferable Price Action: Further upside to 1748.30 and 1759.20
Alternative Price Action: If the price gives a downside breakout of a pivot, then the price extends to 1715.90 and 1703.10.
Comment: MACD is positive territory and Pairs above 20MA.
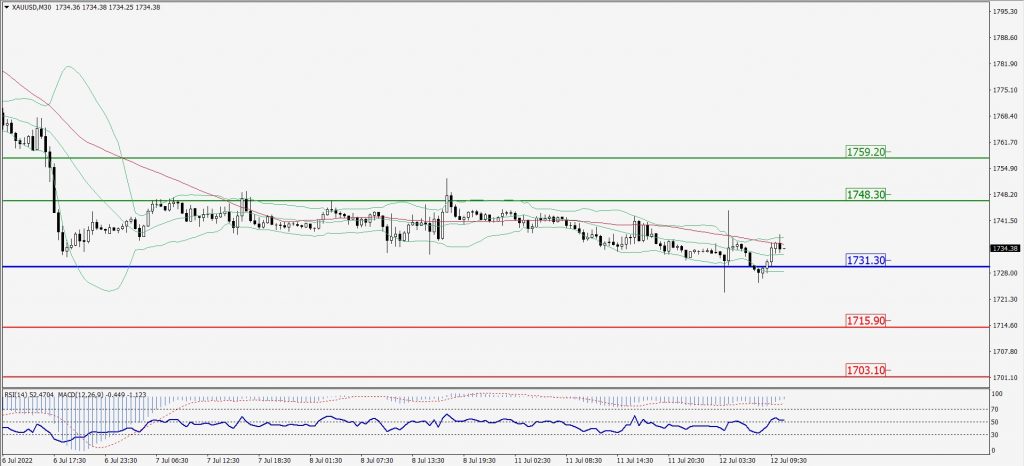
Green Lines Indicate Resistance Levels – Red Lines Indicate Support Levels
Light Blue is a Pivot Point – Black represents the price when the report was produced
Dow Jones Intraday: Trend on the downside
Our pivot point is 31,045.00
Preferable Price Action: Take sell positions below pivot with targets at 30,789.00 & 30,595.00.
Alternative Price Action: Above 31,045.00 looks for further upside to 31,268.00 & 31,443.00.
Comment: RSI below 50 levels and Pair below its 20MA & 55MA.
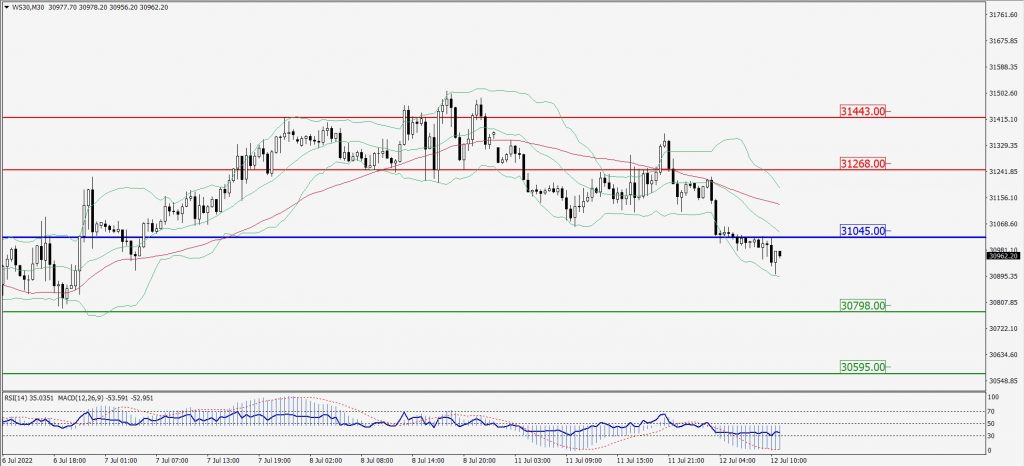
Green Lines Indicate Resistance Levels – Red Lines Indicate Support Levels
Light Blue is a Pivot Point – Black represents the price when the report was produced