Market Wrap: Stocks, Bonds, Commodities
Wall Street ended in the negative territory on Tuesday as growing signs of recession kept buyers out of the equity market ahead of inflation data.
The Dow Jones Industrial Average fell 192.51 points to 30,981.33, the S&P 500 lose 35.63 points to 3,818.80 and the Nasdaq Composite subtract 107.87 points to 11,264.70.
MSCI’s index of Asia-Pacific stocks outside Japan is ascend 0.54% to 635.24 levels. Australian index higher 0.23% to 6,6212.60. Japanese Nikkei Index ascend 0.54% to 26,478.77.
European stocks were negative on Wednesday, with the Stoxx Europe 50 Index fell 1.10% to 3,448.85, Germany’s DAX decline 1.27% to 12,739.97, and France’s CAC drop 1.06% to 5,980.81, and U.K.’s FTSE 100 slipped 1.26% to 7,121.90.
Benchmark 10-year U.S. Treasury fell as demand for safe assets ascend again, today 10-year bond yields a negative 0.07% to 2.9560.
Oil prices fell in early Asian trading on Wednesday as U.S. inventory data showed buildups in crude oil and refined products amid rising fears of a global economic slowdown.
Spot Brent crude oil add 0.73% to $100.21 per barrel. US West Texas Intermediate crude is up 0.81% to $96.58 a barrel.
The yellow metal gold is advance 0.05% to 1,724.90 dollars per ounce.
Market Wrap: Forex
The U.S. dollar edged higher in early European trade Wednesday, while the euro languished close to parity ahead of the release of key U.S. inflation data which could cement further hefty rate hikes by the Federal Reserve.
Today, the U.S. dollar index measures the Greenback against a trade-weighted basket of six major currencies, which is rose 0.12% to 108.032.
The Euro US Dollar (EUR/USD) is a widely traded pair that is down 0.05% today. This left the pair trading around $1.00310.
The Japanese yen was positive against the U.S. dollar on Wednesday as the stock up. Today USD/JPY is ascend 0.16% to 137.060 level.
Another commodity-related currency mixed against the U.S dollar, AUD/USD gain 0.23% to 0.67710, and NZD/USD down 0.01 to 0.61360 level.
EUR/USD Intraday: Trend on the downside
Our pivot point is at 1.00550
Preferable Price Action: Take sell positions below pivot level with targets at 1.99380 & 0.98500 in extension.
Alternative Price Action: Above pivot looks for a further upside to 1.01610 & 1.02460.
Comment: RSI below 50 levels and Pair below its 20MA & 55MA.
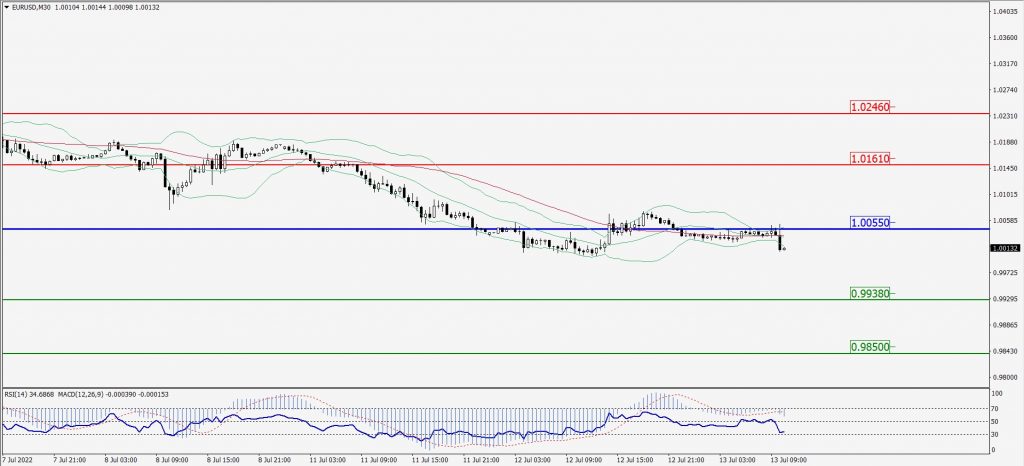
Green Lines Indicate Resistance Levels – Red Lines Indicate Support Levels
Light Blue is a Pivot Point – Black represents the price when the report was produced
GBP/USD Intraday: In a consolidation zone
Our pivot point is at 1.18780
Preferable Price Action: Buy positions below pivot with targets at 1.19760 & 1.20440 in extension.
Alternative Price Action: The price below pivot would call for further downside to 1.17920 & 1.17270.
Comment: RSI at 50 levels pair above 55MA.
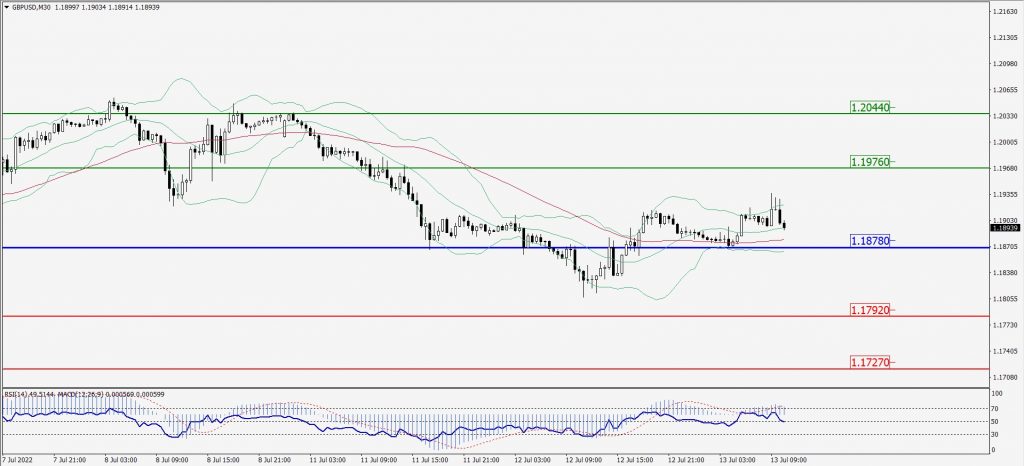
Green Lines Indicate Resistance Levels – Red Lines Indicate Support Levels
Light Blue is a Pivot Point – Black represents the price when the report was produced
USD/JPY Intraday: Trend on the upside
Our pivot point is at 136.900
Preferable Price Action: Buy position above pivot with the target at 137.990 and 138.860 in extension.
Alternative Price Action: The downside breakout of the pivot would call for 135.960 and 135.240.
Comment: MACD is positive territory and Pair above its 20MA & 55MA.
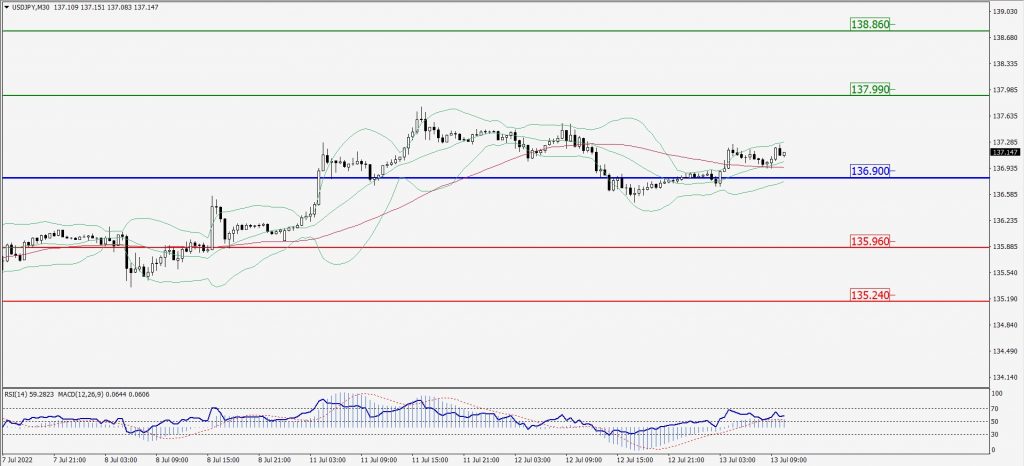
Green Lines Indicate Resistance Levels – Red Lines Indicate Support Levels
Light Blue is a Pivot Point – Black represents the price when the report was produced
AUD/USD Intraday: Support level at 0.67500
Our pivot point is at 0.67500
Preferable Price Action: Buy Positions above pivot with targets at 0.67990 & 0.68320 in extension.
Alternative Price Action: Below pivot looks for a further downside with 0.67070 & 0.66730 as targets.
Comment: RSI above 50 levels and Pair above its 20MA & 55MA.
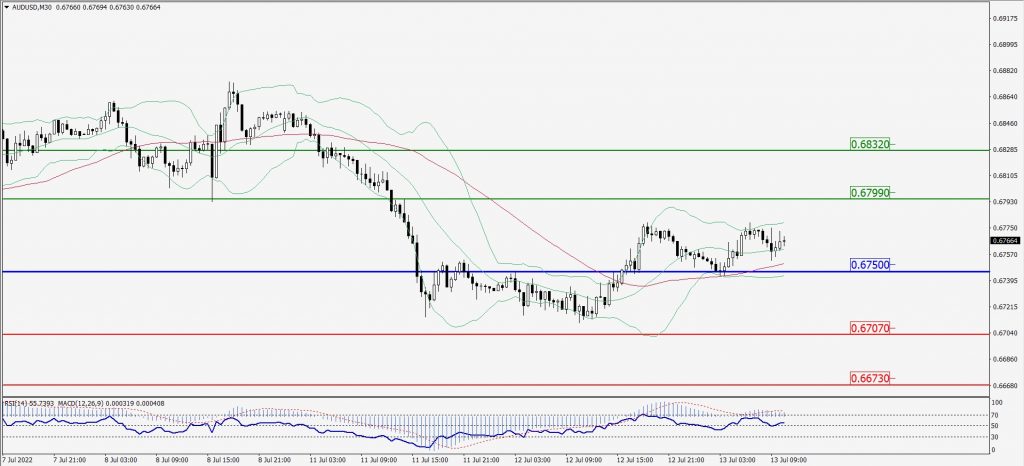
Green Lines Indicate Resistance Levels – Red Lines Indicate Support Levels
Light Blue is a Pivot Point – Black represents the price when the report was produced
CRUDEOIL Intraday: Trend on the upside
Our pivot point is at 93.84
Preferable Price Action: Above pivots buy oil with 97.69 & 100.36 as targets.
Alternative Price Action: Sell crude below pivot with targets at 90.38 and 87.63 in extension.
Comment: MACD is in the positive territory and Pair above 20MA.
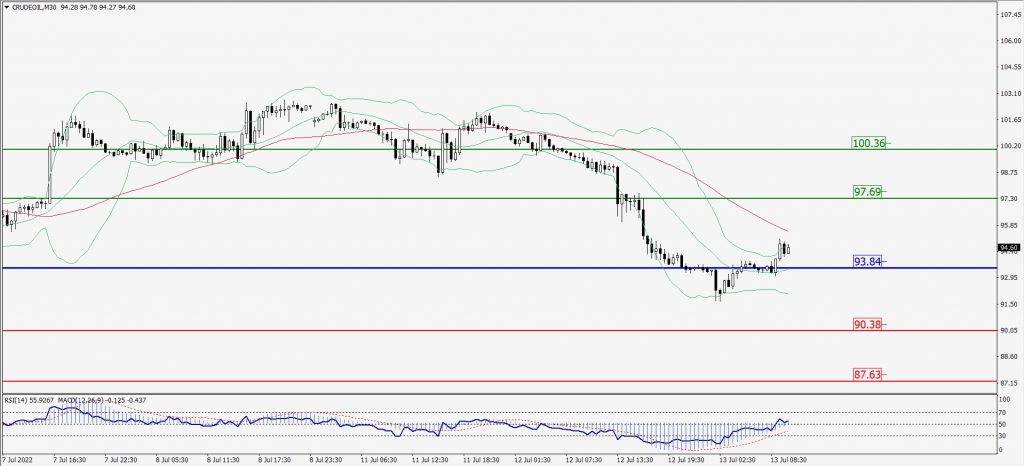
Green Lines Indicate Resistance Levels – Red Lines Indicate Support Levels
Light Blue is a Pivot Point – Black represents the price when the report was produced
XAU/USD Intraday: Trend on the downside
Our pivot point is 1730.80
Preferable Price Action: Further downside to 1714.40 and 1702.50
Alternative Price Action: If the price gives an upside breakout of a pivot, then the price extends to 1745.00 and 1756.00.
Comment: MACD is negative territory and Pairs below 55MA.
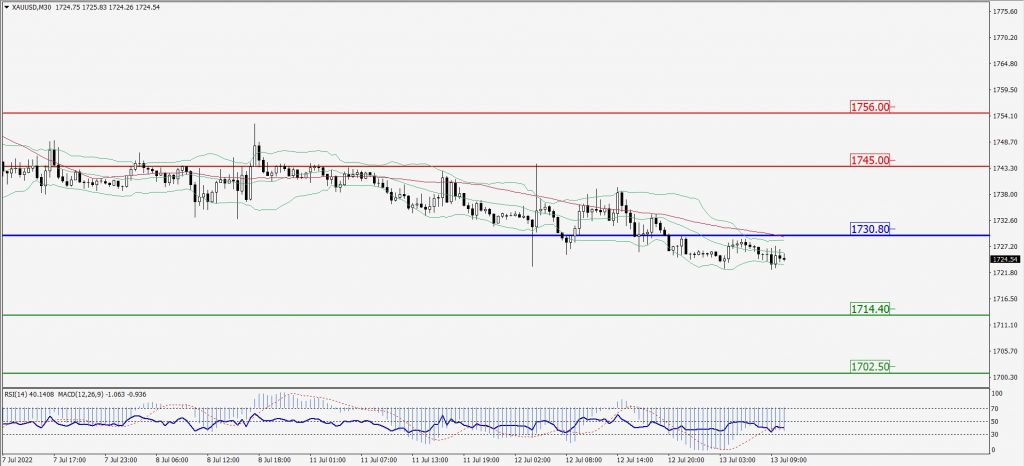
Green Lines Indicate Resistance Levels – Red Lines Indicate Support Levels
Light Blue is a Pivot Point – Black represents the price when the report was produced
Dow Jones Intraday: Major resistance level at 31,056.00
Our pivot point is 31,056.00
Preferable Price Action: Take sell positions below pivot with targets at 30,804.00 & 30,603.00.
Alternative Price Action: Above 31,056.00 looks for further upside to 31,277.00 & 31,473.00.
Comment: RSI below 50 levels and Pair below its 20MA & 55MA.
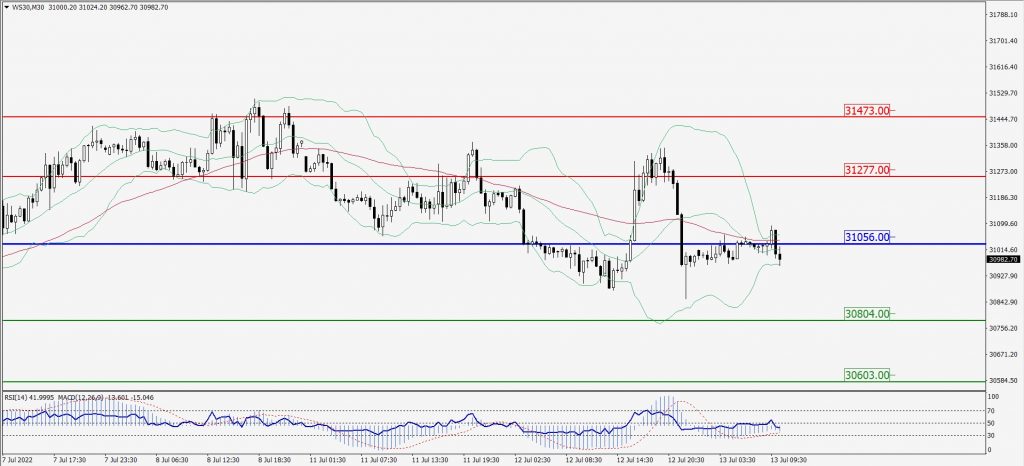
Green Lines Indicate Resistance Levels – Red Lines Indicate Support Levels
Light Blue is a Pivot Point – Black represents the price when the report was produced