Market Wrap: Stocks, Bonds, Commodities
Shares rose broadly across Asia on Monday, building on morning gains and a Friday Wall Street rebound as sentiment improved and oil prices steadied, tempering fears of prolonged inflation.
The Dow Jones Industrial Average rose 823.32 points to 31,500.68, the S&P 500 gain 116.01 points to 3,911.74 and the Nasdaq Composite add 375.43 points to 11,607.62.
MSCI’s index of Asia-Pacific stocks outside Japan is ascend 1.81% to 671.15 levels. Australian index higher 1.94% to 6,706.00. Japanese Nikkei Index ascend 1.43% to 26,871.27.
European stocks were positive on Monday, with the Stoxx Europe 50 Index rose 1.48% to 3,585.45, Germany’s DAX advance 1.68% to 13,336.05, and France’s CAC gain 1.03% to 6,136.13, and U.K.’s FTSE 100 surge 0.91% to 7,275.56.
Benchmark 10-year U.S. Treasury fell as demand for safe assets ascend again, today 10-year bond yields a positive 1.10% to 3.1580.
European natural gas prices rose as Russia’s deep supply cuts are slowing the pace of refilling storage sites, threatening to fall short of the levels required to keep homes warm in the coming winter.
Spot Brent crude oil subtract 0.04% to $109.10 per barrel. US West Texas Intermediate crude is down 0.14% to $107.47 a barrel.
The yellow metal gold is advance 0.63% to 1,841.85 dollars per ounce.
Market Wrap: Forex
The U.S. dollar struggled versus its major rivals on Monday as traders reassessed the prospects of aggressive rate hikes, while the euro led gainers at the start of the European Central Bank’s annual summit in Portugal.
Today, the U.S. dollar index measures the Greenback against a trade-weighted basket of six major currencies, which is a fell 0.31% to 103.638.
The Euro US Dollar (EUR/USD) is a widely traded pair that is up 0.25% today. This left the pair trading around $1.05810.
The Japanese yen was positive against the U.S. dollar on Monday as the stock up. Today USD/JPY is drop 0.07% to 135.090 level.
Another commodity-related currency mixed against the U.S dollar, AUD/USD lose 0.17% to 0.69360, and NZD/USD up 0.05 to 0.63180 level.
EUR/USD Intraday: Trend on the upside
Our pivot point is at 1.05710
Preferable Price Action: Take buy positions above pivot level with targets at 1.06250 & 1.06680 in extension.
Alternative Price Action: Below pivot looks for a further downside to 1.05210 & 1.04810.
Comment: RSI above 50 levels and Pair above its 20MA & 55MA.
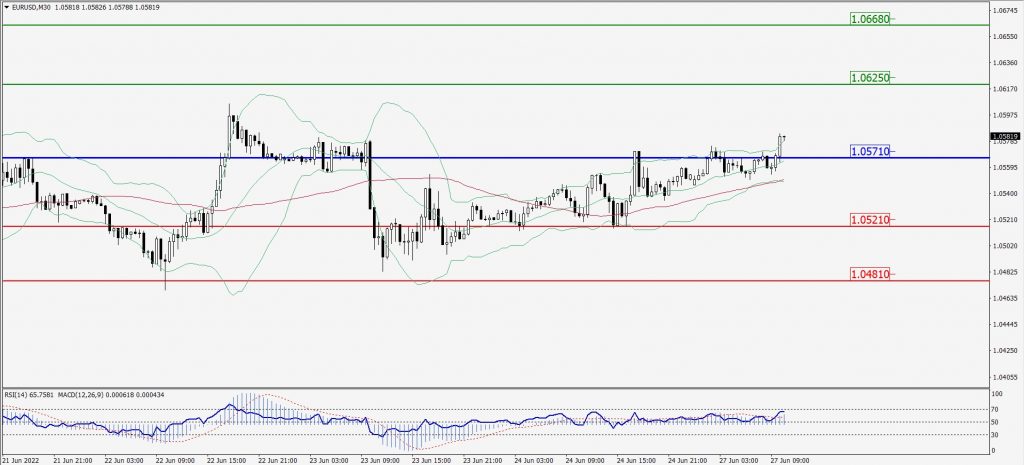
Green Lines Indicate Resistance Levels – Red Lines Indicate Support Levels
Light Blue is a Pivot Point – Black represents the price when the report was produced
GBP/USD Intraday: Trend on the upside
Our pivot point is at 1.23160
Preferable Price Action: Buy positions above pivot with targets at 1.24080 & 1.24750 in extension.
Alternative Price Action: The price below pivot would call for further downside to 1.22420 & 1.21820.
Comment: RSI above 50 levels pair above its 20MA & 55MA.
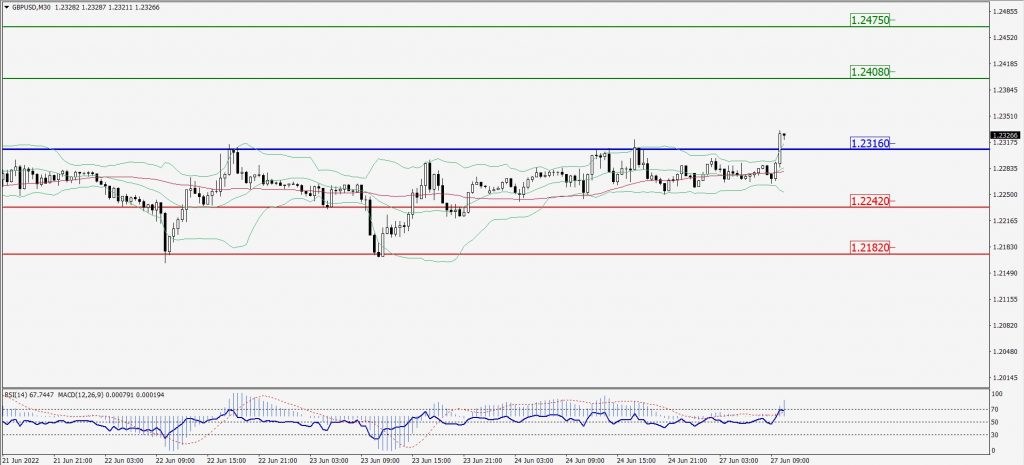
Green Lines Indicate Resistance Levels – Red Lines Indicate Support Levels
Light Blue is a Pivot Point – Black represents the price when the report was produced
USD/JPY Intraday: In a consolidation zone
Our pivot point is at 134.810
Preferable Price Action: Buy position above pivot with the target at 135.800 and 136.570 in extension.
Alternative Price Action: The downside breakout of the pivot would call for 133.950 and 133.200.
Comment: MACD is flat territory and Pair above 20MA.
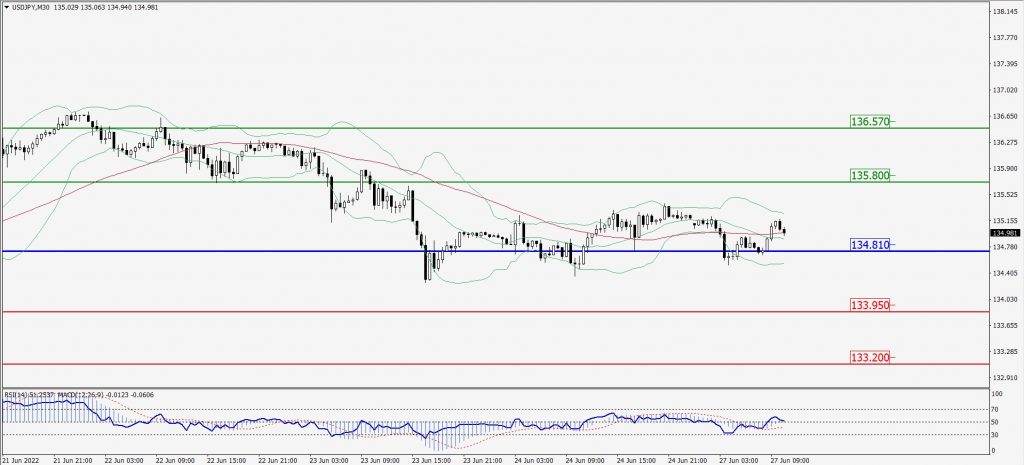
Green Lines Indicate Resistance Levels – Red Lines Indicate Support Levels
Light Blue is a Pivot Point – Black represents the price when the report was produced
AUD/USD Intraday: Support level at 0.69250
Our pivot point is at 0.69250
Preferable Price Action: Buy Positions above pivot with targets at 0.69810 & 0.70300 in extension.
Alternative Price Action: Below pivot looks for a further downside with 0.68720 & 0.68310 as targets.
Comment: RSI above 50 levels and Pair above its 20MA & 55MA.
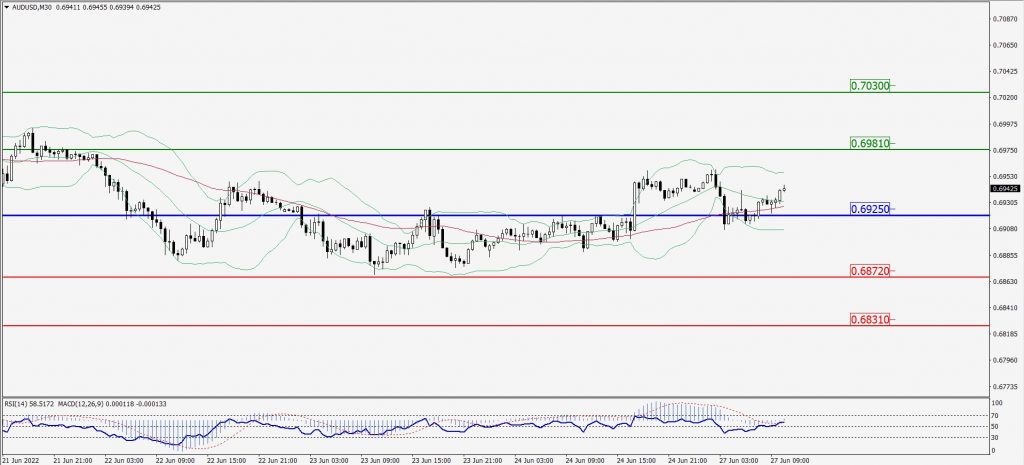
Green Lines Indicate Resistance Levels – Red Lines Indicate Support Levels
Light Blue is a Pivot Point – Black represents the price when the report was produced
CRUDEOIL Intraday: Trend on the upside
Our pivot point is at 105.99
Preferable Price Action: Above pivots buy oil with 110.11 & 112.46 as targets.
Alternative Price Action: Sell crude below pivot with targets at 102.99 and 100.03 in extension.
Comment: MACD is in the positive territory and Pair above its 20MA & 55MA.
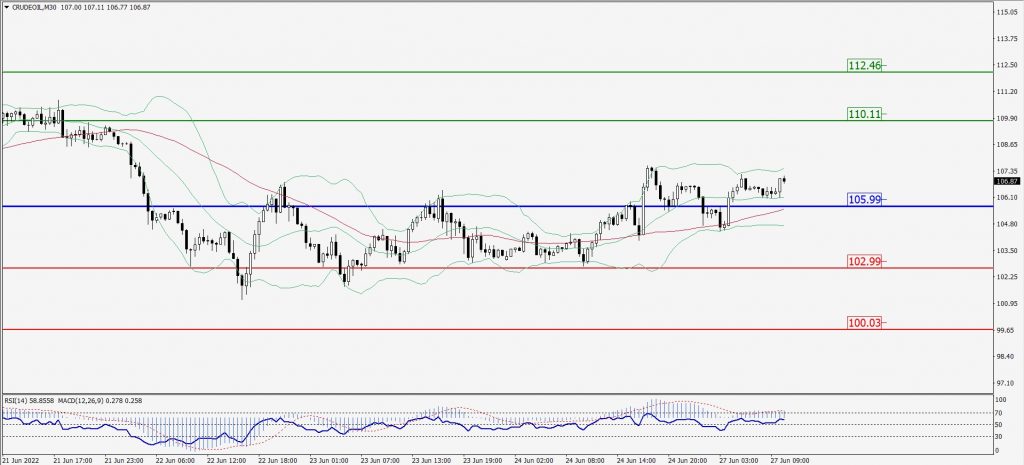
Green Lines Indicate Resistance Levels – Red Lines Indicate Support Levels
Light Blue is a Pivot Point – Black represents the price when the report was produced
XAU/USD Intraday: May trend reverse from 1835.70
Our pivot point is 1835.70
Preferable Price Action: Further upside to 1848.20 and 1857.10
Alternative Price Action: If the price gives a downside breakout of a pivot, then the price extends to 1825.40 and 1816.00.
Comment: MACD is positive territory and Pair above its 20MA & 55MA.
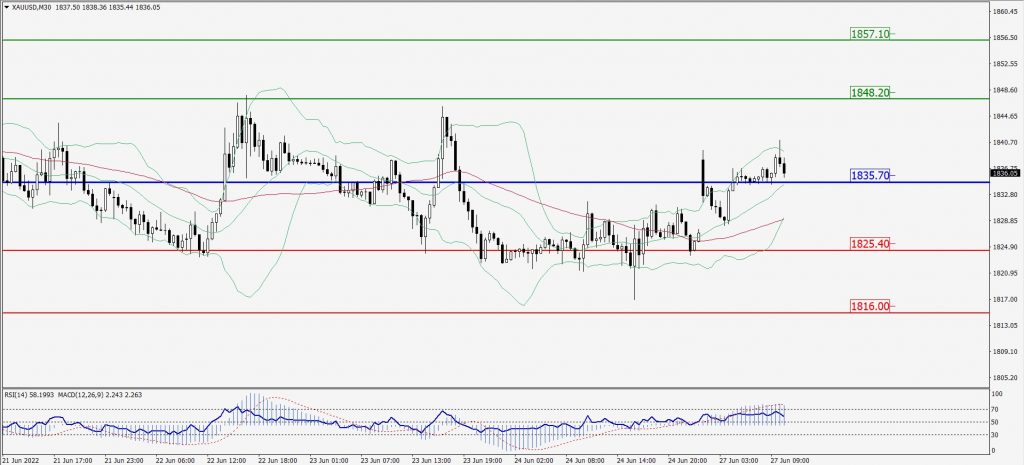
Green Lines Indicate Resistance Levels – Red Lines Indicate Support Levels
Light Blue is a Pivot Point – Black represents the price when the report was produced
Dow Jones Intraday: Major trend on the upside
Our pivot point is 31,511.00
Preferable Price Action: Take buy positions above pivot with targets at 32,318.00 & 32,905.00.
Alternative Price Action: Below 31,511.00 looks for further downside to 30,732.00 & 30,231.00.
Comment: RSI above 50 levels and Pair above its 20MA & 55MA.
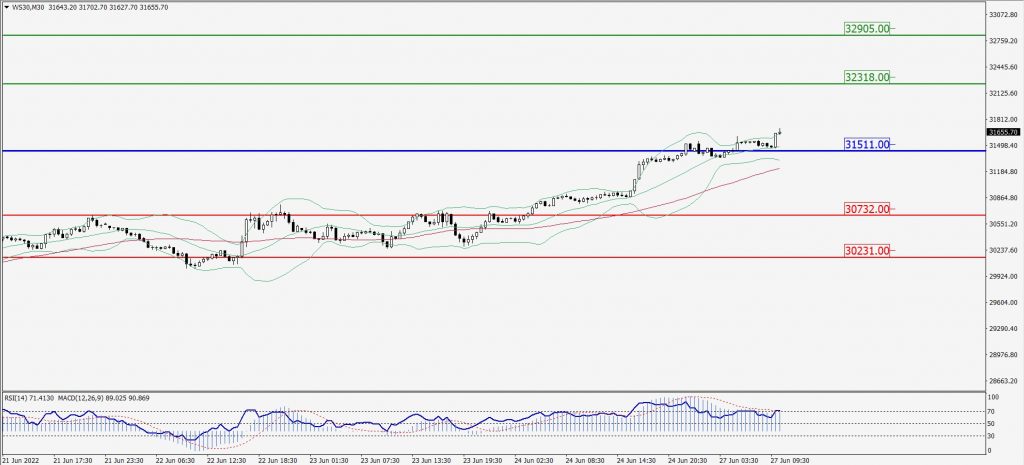
Green Lines Indicate Resistance Levels – Red Lines Indicate Support Levels
Light Blue is a Pivot Point – Black represents the price when the report was produced