Market Wrap: Stocks, Bonds, Commodities
US stocks closed lower on Monday, with a few catalysts to sway investor sentiment as they approach the half-way point of a year in which the equity markets have been slammed by heightened inflation worries and tightening Fed policy.
The Dow Jones Industrial Average fell 62.42 points to 31,438.26, the S&P 500 lose 11.63 points to 3,900.11 and the Nasdaq Composite subtract 83.07 points to 11,524.55.
MSCI’s index of Asia-Pacific stocks outside Japan is ascend 0.21% to 671.30 levels. Australian index higher 0.86% to 6,763.60. Japanese Nikkei Index ascend 0.66% to 27,049.47.
European stocks were positive on Tuesday, with the Stoxx Europe 50 Index rose 0.72% to 3,567.15, Germany’s DAX advance 0.68% to 13,277.39, and France’s CAC gain 1.14% to 6,116.04, and U.K.’s FTSE 100 surge 1.09% to 7,339.84.
Benchmark 10-year U.S. Treasury fell as demand for safe assets ascend again, today 10-year bond yields a positive 0.77% to 3.2190.
Oil prices rose about 1 percent in early Asian trade on Tuesday after the United Arab Emirates’ energy minister said the nation is producing near capacity, countering expectations that it could help boost supply in a tight market.
Spot Brent crude oil add 0.90% to $111.97 per barrel. US West Texas Intermediate crude is up 0.89% to $110.53 a barrel.
The yellow metal gold is advance 0.24% to 1,829.15 dollars per ounce.
Market Wrap: Forex
The rouble pared early losses in volatile Moscow trade on Monday as Russia looked set for its first sovereign default in more than a century after a payment deadline expired and the West promised more actions against Moscow over the Ukraine conflict.
Today, the U.S. dollar index measures the Greenback against a trade-weighted basket of six major currencies, which is a rose 0.05% to 103.725.
The Euro US Dollar (EUR/USD) is a widely traded pair that is down 0.05% today. This left the pair trading around $1.05790.
The Japanese yen was positive against the U.S. dollar on Tuesday as the stock up. Today USD/JPY is ascend 0.26% to 135.770 level.
Another commodity-related currency mixed against the U.S dollar, AUD/USD gain 0.36% to 0.69480, and NZD/USD down 0.12 to 0.62920 level.
EUR/USD Intraday: Trend on the upside
Our pivot point is at 1.05840
Preferable Price Action: Take buy positions above pivot level with targets at 1.06530 & 1.06950 in extension.
Alternative Price Action: Below pivot looks for a further downside to 1.05280 & 1.04880.
Comment: RSI above 50 levels and Pair above its 20MA & 55MA.
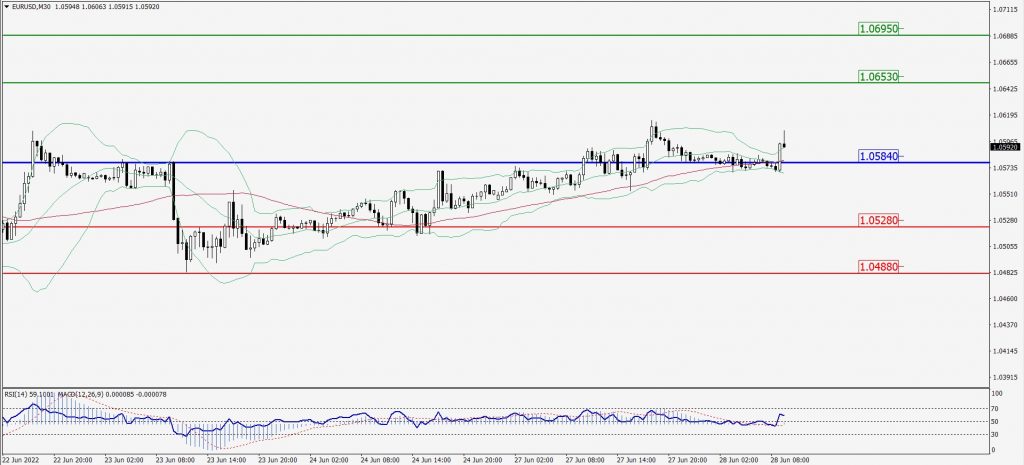
Green Lines Indicate Resistance Levels – Red Lines Indicate Support Levels
Light Blue is a Pivot Point – Black represents the price when the report was produced
GBP/USD Intraday: Major support level at 1.22700
Our pivot point is at 1.22700
Preferable Price Action: Buy positions above pivot with targets at 1.23400 & 1.23930 in extension.
Alternative Price Action: The price below pivot would call for further downside to 1.22060 & 1.21560.
Comment: RSI above 50 levels pair above its 20MA & 55MA.
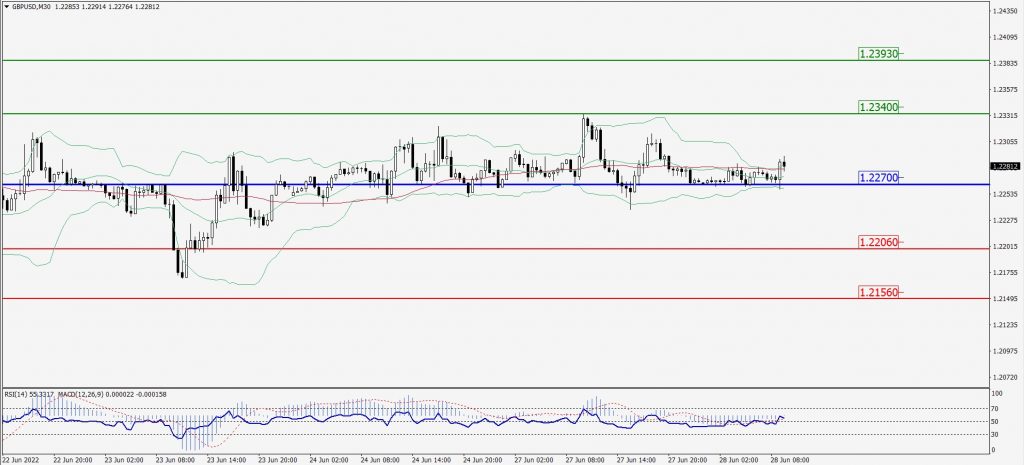
Green Lines Indicate Resistance Levels – Red Lines Indicate Support Levels
Light Blue is a Pivot Point – Black represents the price when the report was produced
USD/JPY Intraday: Trend on the upside
Our pivot point is at 135.290
Preferable Price Action: Buy position above pivot with the target at 136.300 and 136.970 in extension.
Alternative Price Action: The downside breakout of the pivot would call for 134.360 and 133.720.
Comment: MACD is positive territory and Pair above its 20MA & 55MA.
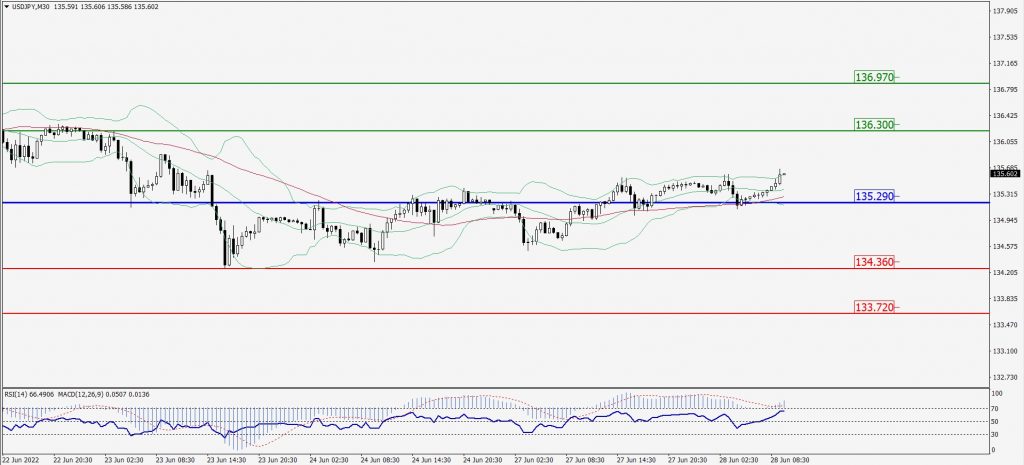
Green Lines Indicate Resistance Levels – Red Lines Indicate Support Levels
Light Blue is a Pivot Point – Black represents the price when the report was produced
AUD/USD Intraday: Resistance level at 0.69450
Our pivot point is at 0.69450
Preferable Price Action: Buy Positions above pivot with targets at 0.70090 & 0.70550 in extension.
Alternative Price Action: Below pivot looks for a further downside with 0.68860 & 0.68440 as targets.
Comment: RSI above 50 levels and Pair above its 20MA & 55MA.
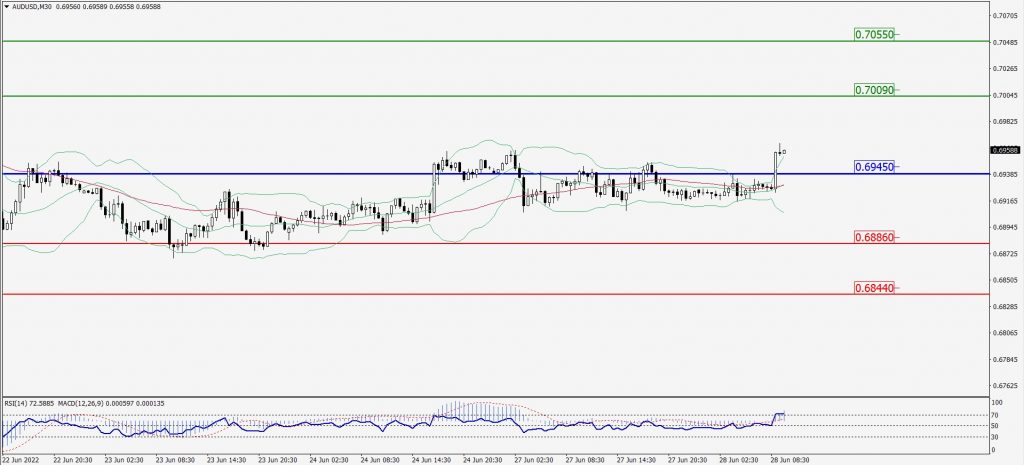
Green Lines Indicate Resistance Levels – Red Lines Indicate Support Levels
Light Blue is a Pivot Point – Black represents the price when the report was produced
CRUDEOIL Intraday: Major trend on the upside
Our pivot point is at 109.61
Preferable Price Action: Above pivots buy oil with 113.22 & 116.33 as targets.
Alternative Price Action: Sell crude below pivot with targets at 106.01 and 103.15 in extension.
Comment: MACD is in the positive territory and Pair above its 20MA & 55MA.
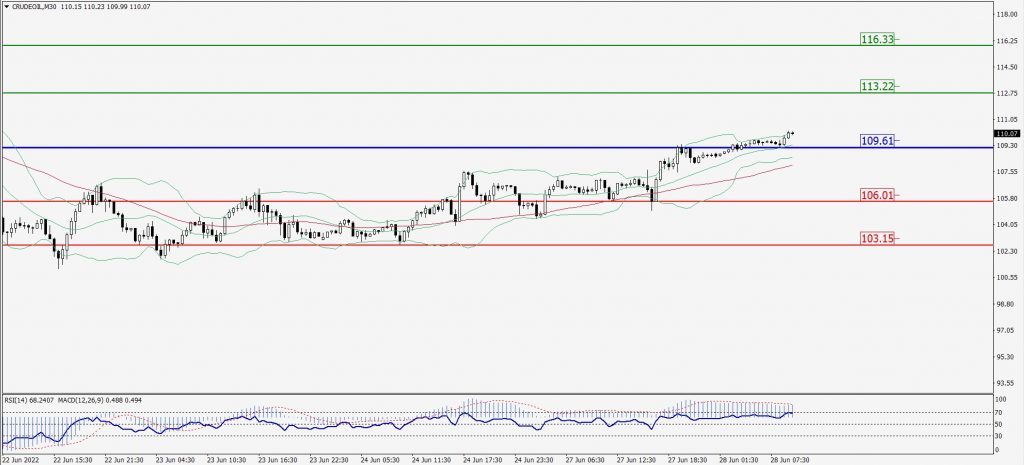
Green Lines Indicate Resistance Levels – Red Lines Indicate Support Levels
Light Blue is a Pivot Point – Black represents the price when the report was produced
XAU/USD Intraday: May trend reverse from 1823.80
Our pivot point is 1823.80
Preferable Price Action: Further upside to 1838.40 and 1849.70
Alternative Price Action: If the price gives a downside breakout of a pivot, then the price extends to 1809.80 and 1798.00.
Comment: MACD is positive territory and Pair above 20MA.
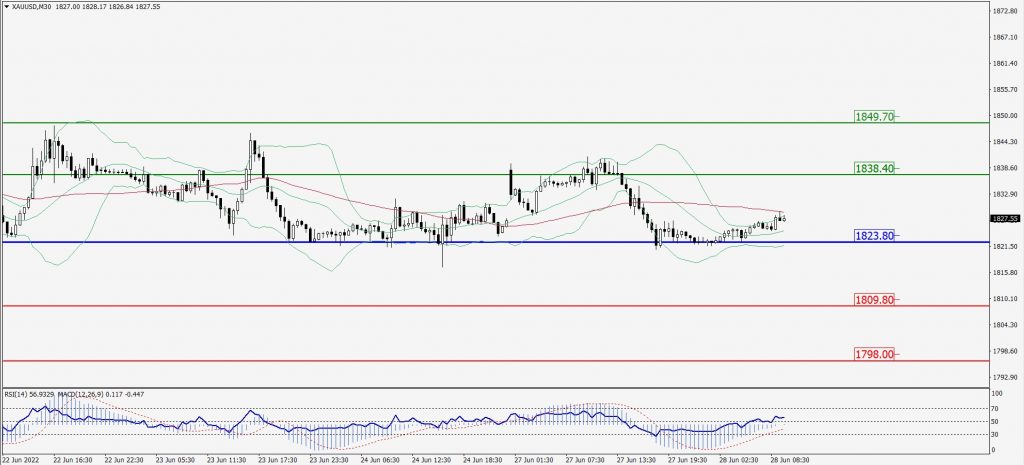
Green Lines Indicate Resistance Levels – Red Lines Indicate Support Levels
Light Blue is a Pivot Point – Black represents the price when the report was produced
Dow Jones Intraday: Major trend on the upside
Our pivot point is 31,446.00
Preferable Price Action: Take buy positions above pivot with targets at 32,256.00 & 32,905.00.
Alternative Price Action: Below 31,446.00 looks for further downside to 30,732.00 & 30,175.00.
Comment: RSI above 50 levels and Pair above its 20MA & 55MA.
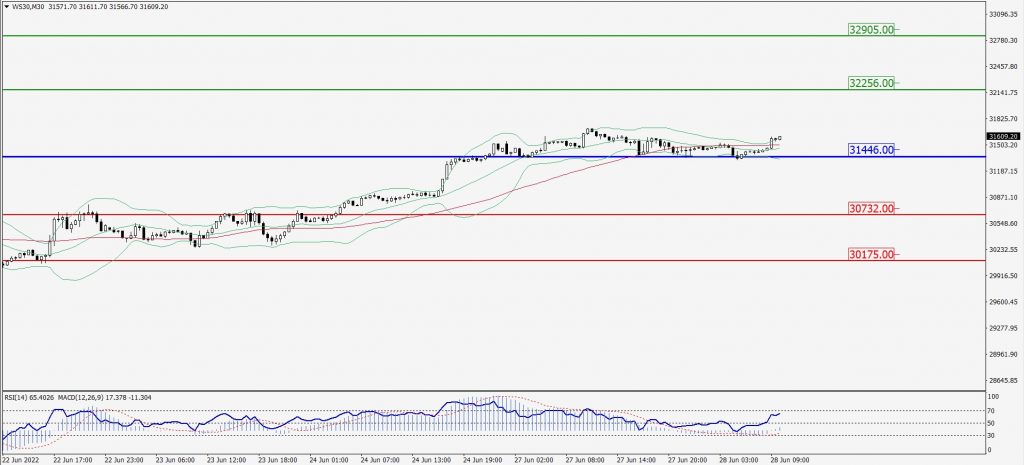
Green Lines Indicate Resistance Levels – Red Lines Indicate Support Levels
Light Blue is a Pivot Point – Black represents the price when the report was produced