Market Wrap: Stocks, Bonds, Commodities
Wall Street’s main indexes posted solid gains on Thursday, fuelled by strong performance from defensive and tech shares that outweighed declines for economically sensitive groups as worries persisted about a potential recession.
The Dow Jones Industrial Average rose 194.23 points to 30,677.36, the S&P 500 gain 35.84 points to 3,795.73 and the Nasdaq Composite add 179.11 points to 11,232.19.
MSCI’s index of Asia-Pacific stocks outside Japan is ascend 1.45% to 657.05 levels. Australian index higher 0.77% to 6,578.70. Japanese Nikkei Index ascend 1.23% to 26,491.97.
European stocks were positive on Friday, with the Stoxx Europe 50 Index rose 0.91% to 3,467.65, Germany’s DAX advance 0.46% to 12,974.08, and France’s CAC gain 1.11% to 5,948.56, and U.K.’s FTSE 100 surge 0.92% to 7,081.50.
Benchmark 10-year U.S. Treasury fell as demand for safe assets ascend again, today 10-year bond yields a negative 0.35% to 3.0590.
Oil prices rose slightly in early Asian trade on Friday as nations seek to address global crude oil and fuel supply tightness. Brent crude futures rose 39 cents, or 0.4%, to $110.44 a barrel at 0012 GMT, while U.S. West Texas Intermediate (WTI) crude futures rose 37 cents, or 0.4%, to $104.31 a barrel.
Spot Brent crude oil subtract 0.18% to $109.83 per barrel. US West Texas Intermediate crude is down 0.12% to $104.12 a barrel.
The yellow metal gold is advance 0.02% to 1,830.60 dollars per ounce.
Market Wrap: Forex
The U.S. dollar slipped slightly on Friday, as investors remained cautious of the impact of tighter central bank policies around the world aimed at curbing soaring inflation.
Today, the U.S. dollar index measures the Greenback against a trade-weighted basket of six major currencies, which is a fell 0.09% to 104.088.
The Euro US Dollar (EUR/USD) is a widely traded pair that is up 0.04% today. This left the pair trading around $1.05280.
The Japanese yen was positive against the U.S. dollar on Friday as the stock up. Today USD/JPY is drop 0.20% to 134.640 level.
Another commodity-related currency positive against the U.S dollar, AUD/USD gain 0.16% to 0.68990, and NZD/USD up 0.30 to 0.62930 level.
EUR/USD Intraday: Trend on the downside
Our pivot point is at 1.05410
Preferable Price Action: Take sell positions below pivot level with targets at 1.05050 & 1.04760 in extension.
Alternative Price Action: Above pivot looks for a further upside to 1.05720 & 1.06010.
Comment: RSI below 50 levels and Pair below 20MA.
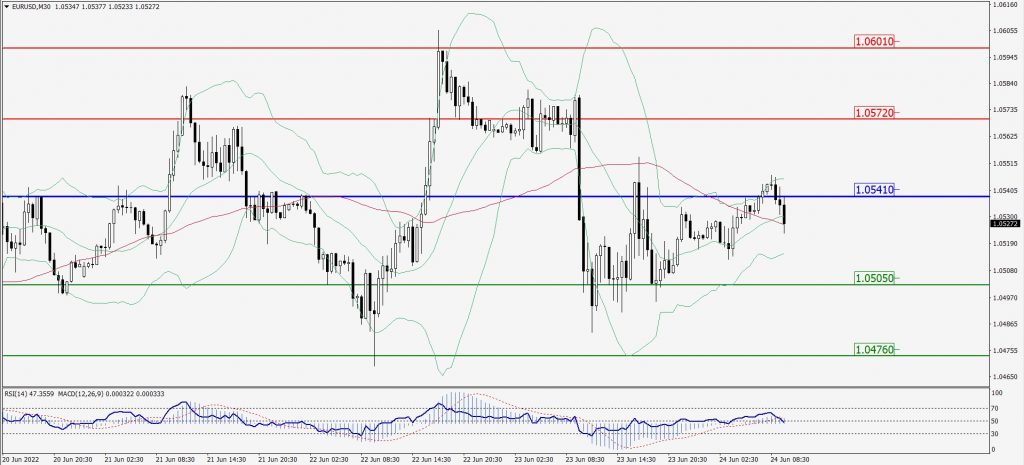
Green Lines Indicate Resistance Levels – Red Lines Indicate Support Levels
Light Blue is a Pivot Point – Black represents the price when the report was produced
GBP/USD Intraday: Support level at 1.22630
Our pivot point is at 1.22630
Preferable Price Action: Buy positions above pivot with targets at 1.23300 & 1.23730 in extension.
Alternative Price Action: The price below pivot would call for further downside to 1.22010 & 1.21560.
Comment: RSI at 50 levels pair above 55MA.
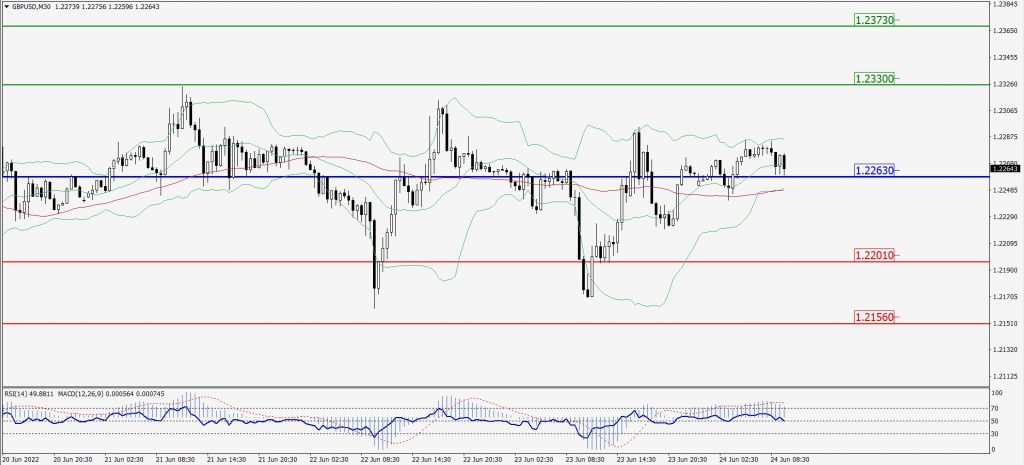
Green Lines Indicate Resistance Levels – Red Lines Indicate Support Levels
Light Blue is a Pivot Point – Black represents the price when the report was produced
USD/JPY Intraday: Resistance level at 134.920
Our pivot point is at 134.920
Preferable Price Action: Sell position below pivot with the target at 133.920 and 133.040 in extension.
Alternative Price Action: The upside breakout of the pivot would call for 135.880 and 136.830.
Comment: MACD is negative territory and Pair below its 20MA & 55MA.
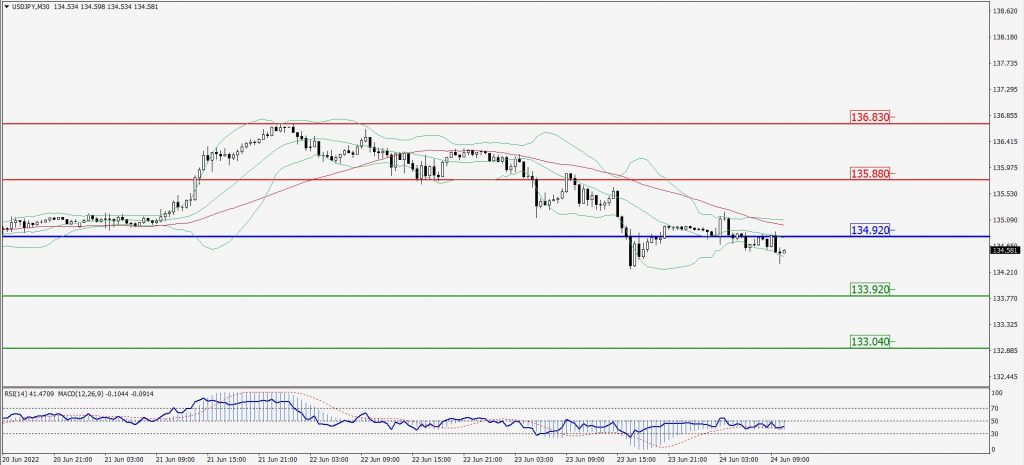
Green Lines Indicate Resistance Levels – Red Lines Indicate Support Levels
Light Blue is a Pivot Point – Black represents the price when the report was produced
AUD/USD Intraday: In a consolidation zone
Our pivot point is at 0.68980
Preferable Price Action: Buy Positions above pivot with targets at 0.69500 & 0.69880 in extension.
Alternative Price Action: Below pivot looks for a further downside with 0.68500 & 0.68160 as targets.
Comment: RSI at 50 levels and Pair above 55MA.
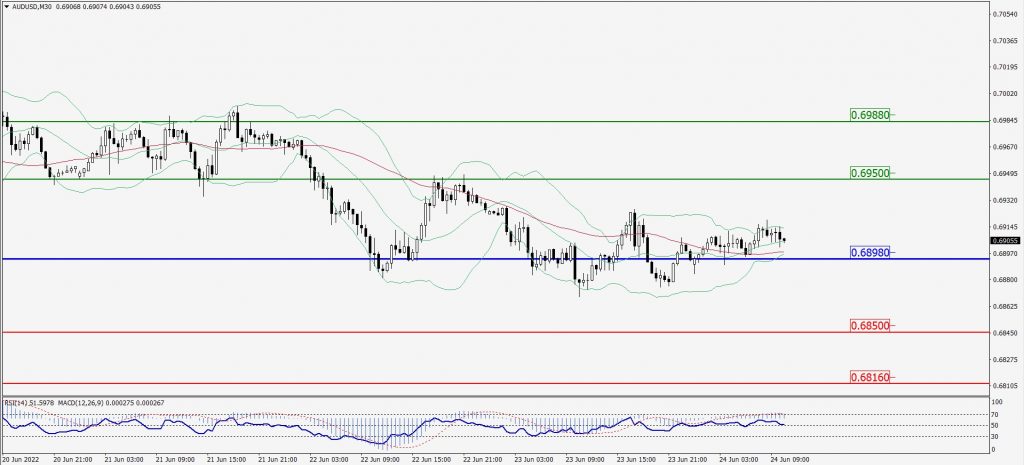
Green Lines Indicate Resistance Levels – Red Lines Indicate Support Levels
Light Blue is a Pivot Point – Black represents the price when the report was produced
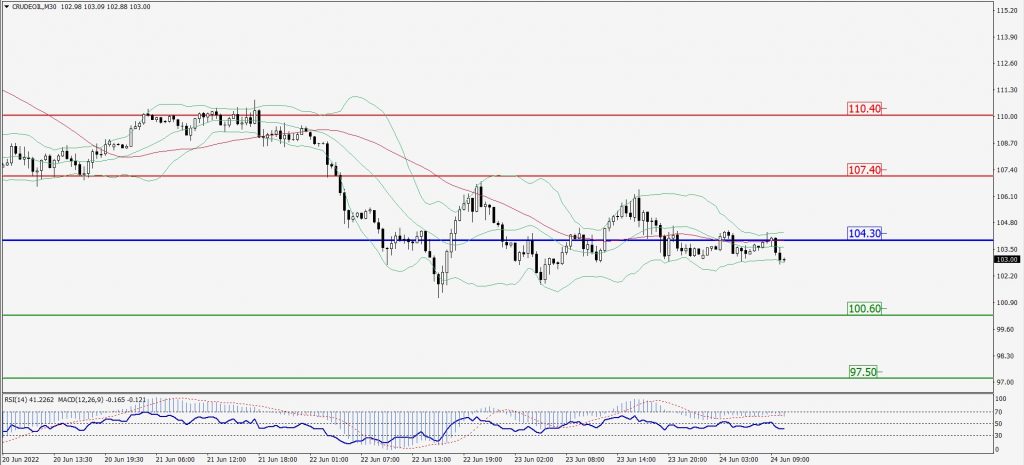
CRUDEOIL Intraday: Trend on the downside
Our pivot point is at 104.30
Preferable Price Action: Below pivots sell oil with 100.60 & 97.50 as targets.
Alternative Price Action: Buy crude above pivot with targets at 107.40 and 110.40 in extension.
Comment: MACD is in the negative territory and Pair below 55MA.
Green Lines Indicate Resistance Levels – Red Lines Indicate Support Levels
Light Blue is a Pivot Point – Black represents the price when the report was produced
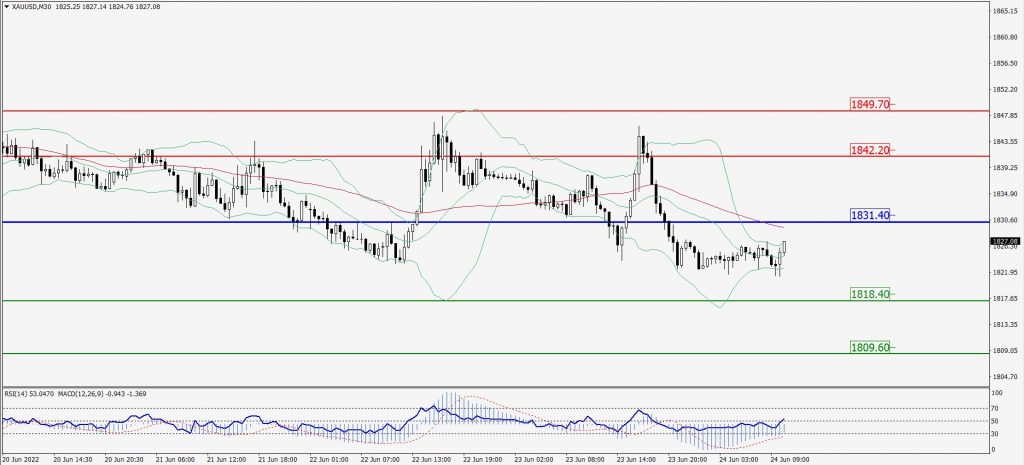
XAU/USD Intraday: May trend reverse from 1831.40
Our pivot point is 1831.40
Preferable Price Action: Further downside to 1818.40 and 1809.60
Alternative Price Action: If the price gives an upside breakout of a pivot, then the price extends to 1842.20 and 1849.70.
Comment: MACD is flat territory and Pair below 55MA.
Green Lines Indicate Resistance Levels – Red Lines Indicate Support Levels
Light Blue is a Pivot Point – Black represents the price when the report was produced
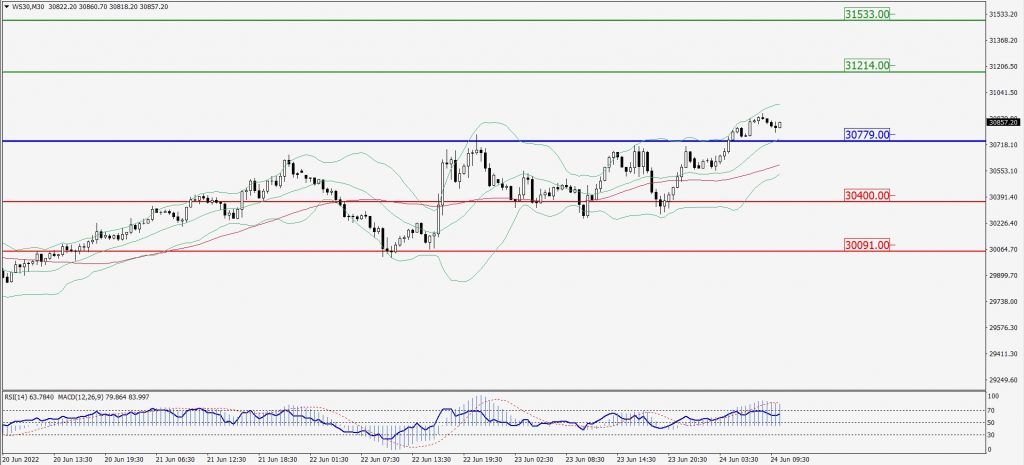
Dow Jones Intraday: Trend on the upside
Our pivot point is 30,779.00
Preferable Price Action: Take buy positions above pivot with targets at 31,214.00 & 31,533.00.
Alternative Price Action: Below 30,779.00 looks for further downside to 30,400.00 & 30,091.00.
Comment: RSI above 50 levels and Pair above its 20MA & 55MA.
Green Lines Indicate Resistance Levels – Red Lines Indicate Support Levels
Light Blue is a Pivot Point – Black represents the price when the report was produced