Market Wrap: Stocks, Bonds, Commodities
Wall Street’s three major indexes closed lower on Tuesday, following a rally last week, as volatile oil markets kept soaring inflation in focus and investors reacted to hawkish comments from a Federal Reserve official.
The Dow Jones Industrial Average fell 222.67 points to 32,990.12, the S&P 500 lose 26.09 points to 4,132.15 and the Nasdaq Composite subtract 49.74 points to 12,081.39.
MSCI’s index of Asia-Pacific stocks outside Japan is drop 0.70% to 683.12 levels. Australian index higher 0.32% to 7,234.00. Japanese Nikkei Index ascend 0.65% to 27,457.89.
European stocks were mixed on Wednesday, with the Stoxx Europe 50 Index fell 0.06% to 3,786.15, Germany’s DAX advance 0.07% to 14,399.62, and France’s CAC lose 0.03% to 6,466.90, and U.K.’s FTSE 100 fell 0.33% to 7,582.83.
Benchmark 10-year U.S. Treasury fell as demand for safe assets ascend again, today 10-year bond yields a positive 0.96% to 2.871.
Oil prices rose in early Asian trade on Wednesday after European Union leaders agreed to a partial and phased ban on Russian oil and China ended its Covid-19 lockdown in Shanghai.
Spot Brent crude oil advance 1.68% to $117.53 per barrel. US West Texas Intermediate crude is up 1.74% to $116.64 a barrel.
The yellow metal gold is decline 0.53% to 1,838.35 dollars per ounce.
Market Wrap: Forex
The U.S. dollar strengthened across the board on Tuesday as Treasury yields climbed and worries over a further acceleration in global inflation depressed investors’ risk appetite.
Today, the U.S. dollar index measures the Greenback against a trade-weighted basket of six major currencies, which is a rose 0.10% to 101.868.
The Euro US Dollar (EUR/USD) is a widely traded pair that is flat today. This left the pair trading around $1.07300.
The Japanese yen was positive against the U.S. dollar on Wednesday as the stock up. Today USD/JPY is rose 0.48% to 129.300 level.
Another commodity-related currency mixed against the U.S dollar, AUD/USD gain 0.15% to 0.71840, and NZD/USD down 0.14 to 0.65040 level.
EUR/USD Intraday: In a consolidation zone
Our pivot point is at 1.07160
Preferable Price Action: Take buy positions above pivot level with targets at 1.07840 & 1.08370 in extension.
Alternative Price Action: Below pivot looks for a further downside to 1.06570 & 1.06080.
Comment: RSI above 50 levels and Pair above 20MA.
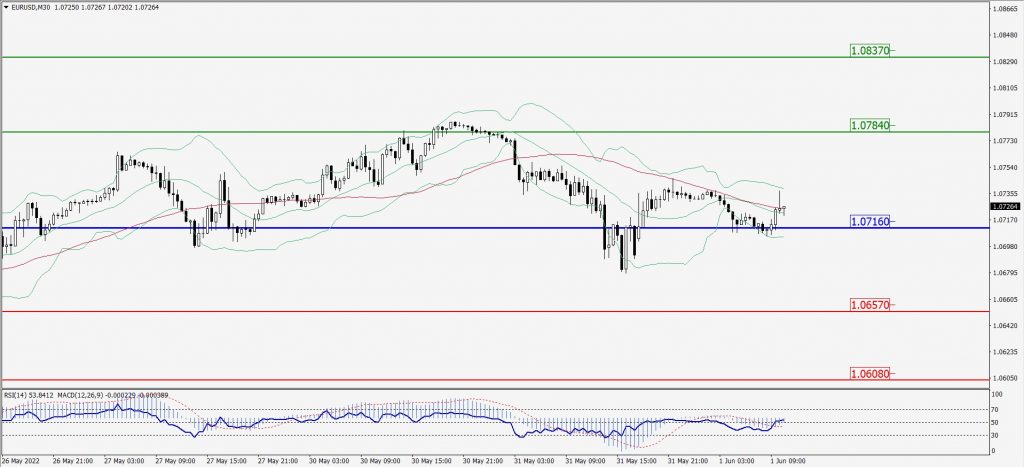
Green Lines Indicate Resistance Levels – Red Lines Indicate Support Levels
Light Blue is a Pivot Point – Black represents the price when the report was produced
GBP/USD Intraday: Support level at 1.25860
Our pivot point is at 1.25860
Preferable Price Action: Buy positions above pivot with targets at 1.26840 & 1.27600 in extension.
Alternative Price Action: The price below pivot would call for further downside to 1.25020 & 1.24310.
Comment: RSI above 50 levels pair above its 20MA & 55MA.
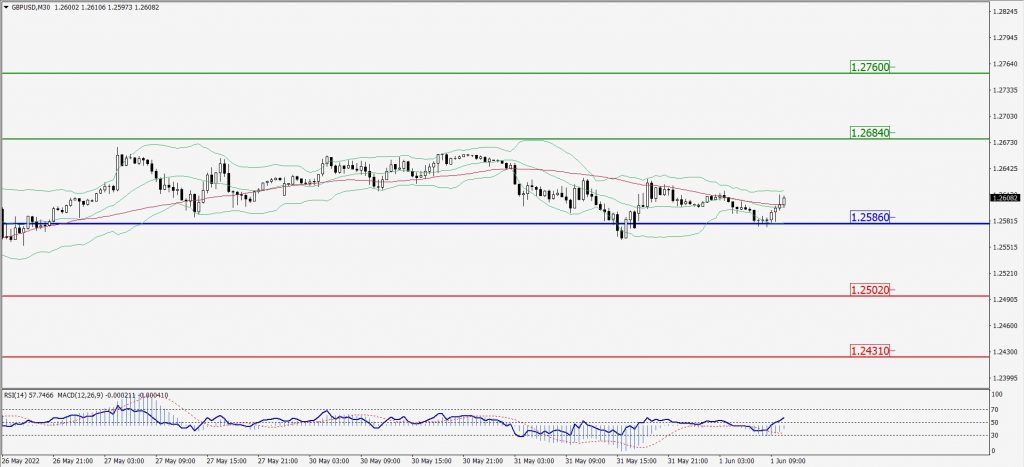
Green Lines Indicate Resistance Levels – Red Lines Indicate Support Levels
Light Blue is a Pivot Point – Black represents the price when the report was produced
USD/JPY Intraday: Major trend on the upside
Our pivot point is at 129.120
Preferable Price Action: Buy position above pivot with the target at 130.250 and 131.030 in extension.
Alternative Price Action: The downside breakout of the pivot would call for 128.140 and 127.290.
Comment: MACD is positive territory and Pair above its 20MA & 55MA.
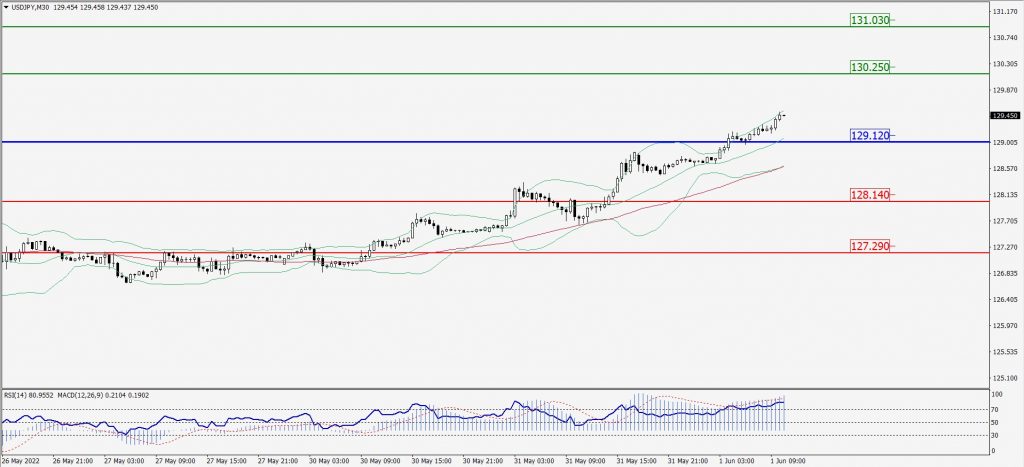
Green Lines Indicate Resistance Levels – Red Lines Indicate Support Levels
Light Blue is a Pivot Point – Black represents the price when the report was produced
AUD/USD Intraday: Major support level at 0.71750
Our pivot point is at 0.71750
Preferable Price Action: Buy Positions above pivot with targets at 0.72410 & 0.73000 in extension.
Alternative Price Action: Below pivot looks for a further downside with 0.71180 & 0.70690 as targets.
Comment: RSI above 50 levels and Pair above 20MA.
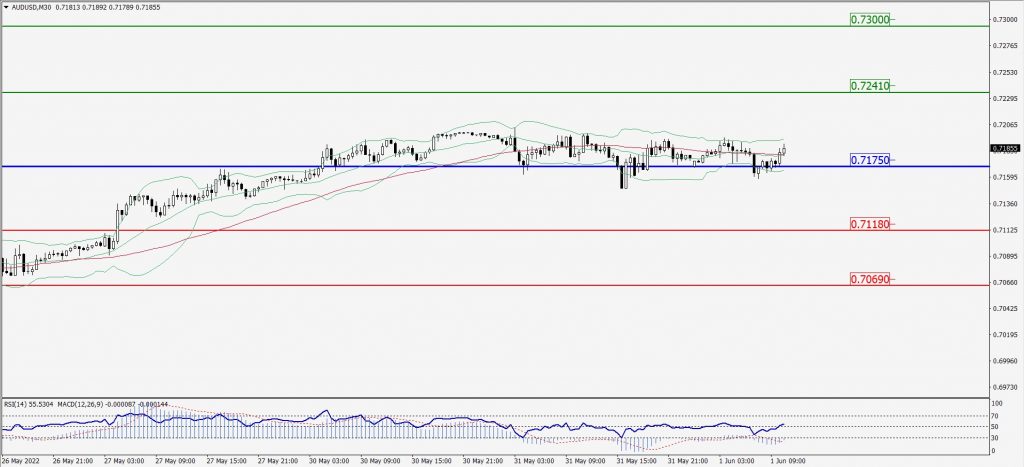
Green Lines Indicate Resistance Levels – Red Lines Indicate Support Levels
Light Blue is a Pivot Point – Black represents the price when the report was produced
CRUDEOIL Intraday: In a consolidation zone
Our pivot point is at 113.98
Preferable Price Action: Above pivots buy oil with 117.57 & 120.46 as targets.
Alternative Price Action: Sell crude below pivot with targets at 110.98 and 108.31 in extension.
Comment: MACD is in the positive territory and Pair above 20MA.
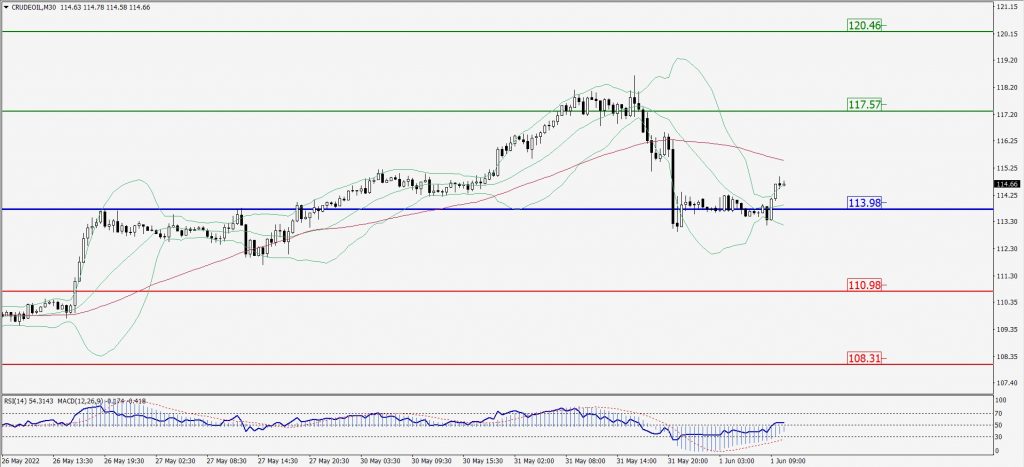
Green Lines Indicate Resistance Levels – Red Lines Indicate Support Levels
Light Blue is a Pivot Point – Black represents the price when the report was produced
XAU/USD Intraday: Trend on the downside
Our pivot point is 1840.30
Preferable Price Action: Further downside to 1823.80 and 1811.60
Alternative Price Action: If the price gives an upside breakout of a pivot, then the price extends to 1855.50 and 1867.50.
Comment: MACD is negative territory and pair below 55MA.
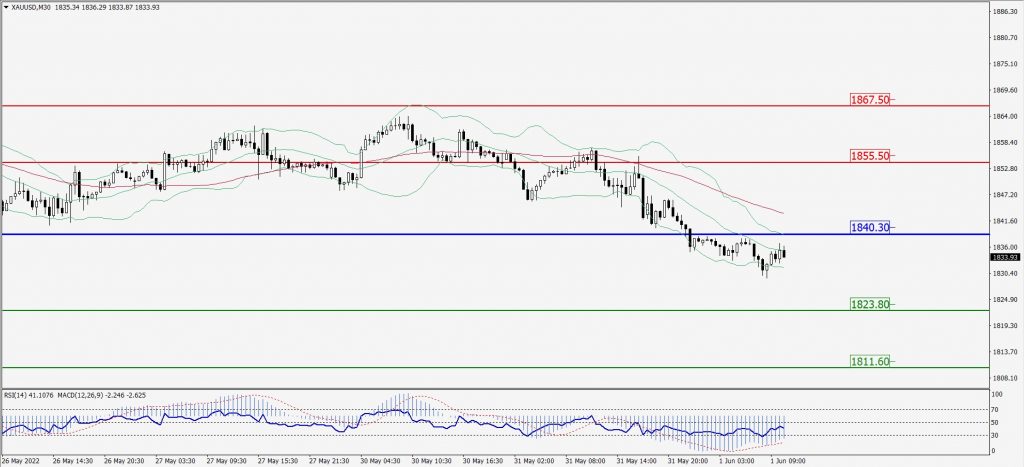
Green Lines Indicate Resistance Levels – Red Lines Indicate Support Levels
Light Blue is a Pivot Point – Black represents the price when the report was produced
Dow Jones Intraday: Trend on the upside
Our pivot point is 33,153.00
Preferable Price Action: Take buy positions above pivot with targets at 33,593.00 & 33,989.00.
Alternative Price Action: Below 33,153.00 looks for further downside to 32,738.00 & 32,363.00.
Comment: RSI above 50 levels and Pair above its 20MA & 55MA.
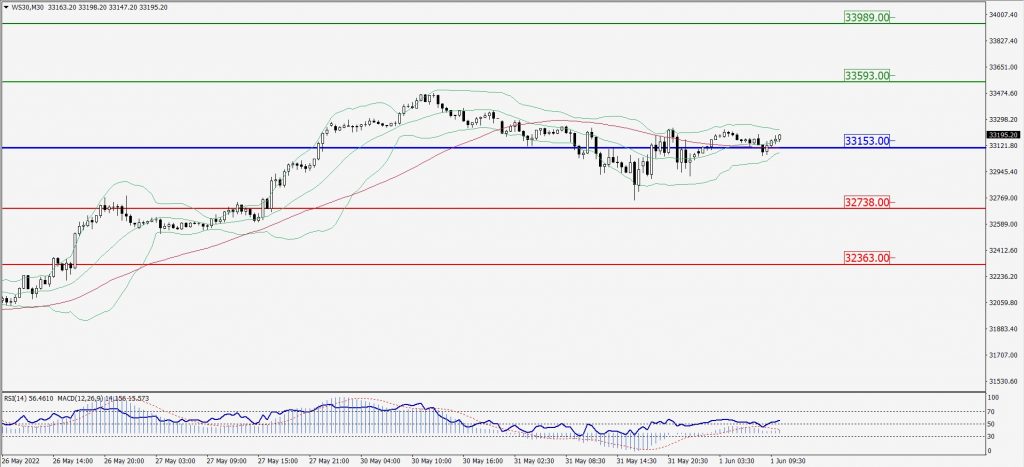
Green Lines Indicate Resistance Levels – Red Lines Indicate Support Levels
Light Blue is a Pivot Point – Black represents the price when the report was produced