Market Wrap: Stocks, Bonds, Commodities
European stock markets are expected to open slightly lower Tuesday, ahead of the release of key regional inflation data which could heighten concerns about the pace and scale of looming interest rate hikes.
MSCI’s index of Asia-Pacific stocks outside Japan is ascend 0.96% to 685.34 levels. Australian index lower 1.03% to 7,211.20. Japanese Nikkei Index drop 0.33% to 27,279.80.
European stocks were negative on Tuesday, with the Stoxx Europe 50 Index fell 0.45% to 3,824.45, Germany’s DAX decline 0.47% to 14,505.29, and France’s CAC lose 0.65% to 6,519.42, and U.K.’s FTSE 100 rose 0.36% to 7,628.40.
Benchmark 10-year U.S. Treasury fell as demand for safe assets ascend again, today 10-year bond yields a positive 2.01% to 2.804.
Oil prices rose on Tuesday after the European Union agreed to slash oil imports from Russia by the end of 2022, fuelling worries of a tighter market already strained for supply amid rising demand ahead of peak US and European summer driving season.
Spot Brent crude oil advance 2.02% to $120.03 per barrel. US West Texas Intermediate crude is up 1.74% to $119.22 a barrel.
The yellow metal gold is advance 0.06% to 1,858.35 dollars per ounce.
Market Wrap: Forex
The U.S. dollar rebounded in early European trade Tuesday, helped by aggressive rate hiking comments from Federal Reserve Governor Christopher Waller, but is still heading for its first monthly drop in five months, especially against the resurgent euro.
Today, the U.S. dollar index measures the Greenback against a trade-weighted basket of six major currencies, which is a rose 0.39% to 101.700.
The Euro US Dollar (EUR/USD) is a widely traded pair that is decline 0.36% today. This left the pair trading around $1.07390.
The Japanese yen was positive against the U.S. dollar on Tuesday as the stock up. Today USD/JPY is rose 0.15% to 127.750 level.
Another commodity-related currency negative against the U.S dollar, AUD/USD lose 0.10% to 0.71890, and NZD/USD down 0.32 to 0.65330 level.
EUR/USD Intraday: Trend on the downside
Our pivot point is at 1.07590
Preferable Price Action: Take sell positions below pivot level with targets at 1.07080 & 1.06690 in extension.
Alternative Price Action: Above pivot looks for a further upside to 1.08100 & 1.08460.
Comment: RSI below 50 levels and Pair below its 20MA & 55MA.
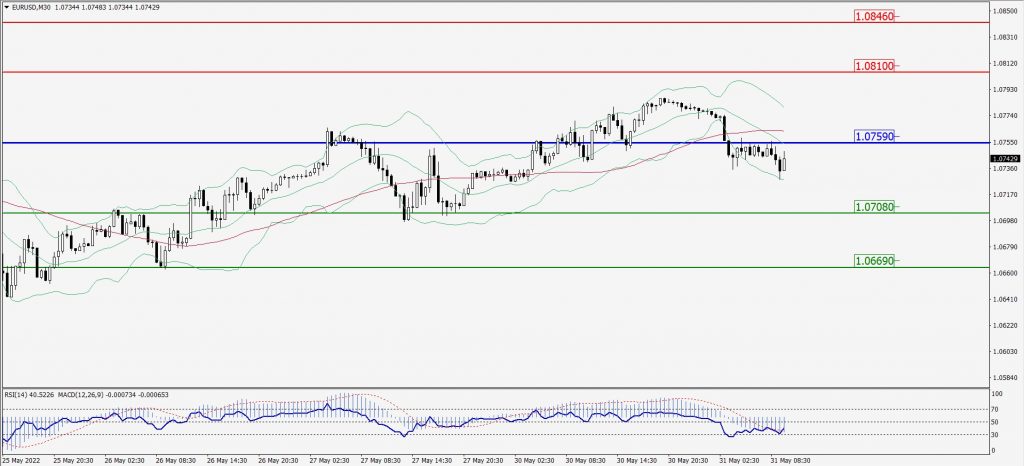
Green Lines Indicate Resistance Levels – Red Lines Indicate Support Levels
Light Blue is a Pivot Point – Black represents the price when the report was produced
GBP/USD Intraday: In a consolidation zone
Our pivot point is at 1.26530
Preferable Price Action: Sell positions below pivot with targets at 1.25740 & 1.25030 in extension.
Alternative Price Action: The price above pivot would call for further upside to 1.27400 & 1.28090.
Comment: RSI below 50 levels pair below its 20MA & 55MA.
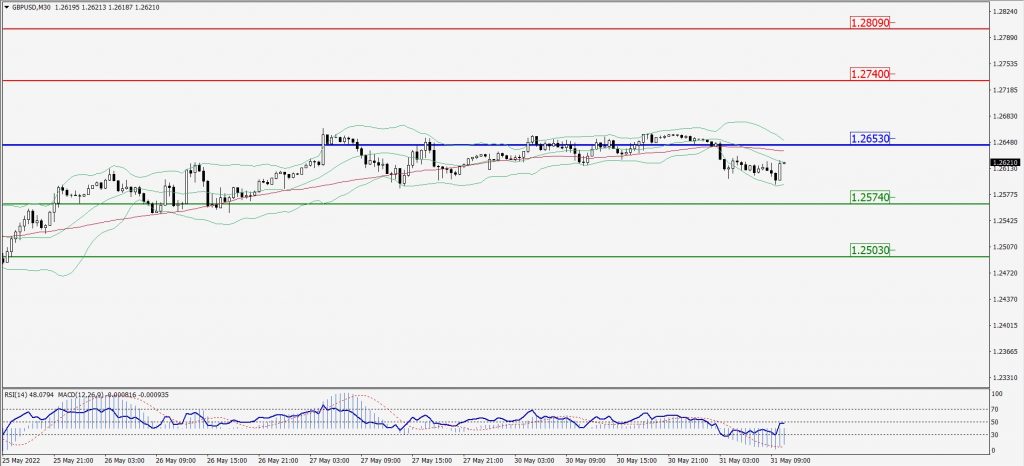
Green Lines Indicate Resistance Levels – Red Lines Indicate Support Levels
Light Blue is a Pivot Point – Black represents the price when the report was produced
USD/JPY Intraday: May trend reverse from 127.960
Our pivot point is at 127.960
Preferable Price Action: Sell position below pivot with the target at 127.350 and 126.870 in extension.
Alternative Price Action: The upside breakout of the pivot would call for 128.570 and 129.030.
Comment: MACD is negative territory and Pair below 20MA.
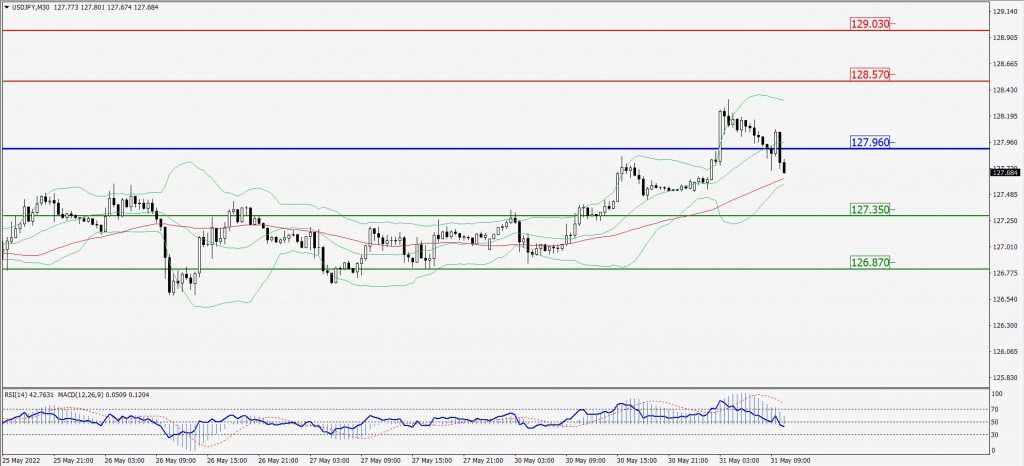
Green Lines Indicate Resistance Levels – Red Lines Indicate Support Levels
Light Blue is a Pivot Point – Black represents the price when the report was produced
AUD/USD Intraday: In a consolidation zone
Our pivot point is at 0.72040
Preferable Price Action: Sell Positions below pivot with targets at 0.71520 & 0.71010 in extension.
Alternative Price Action: Above pivot looks for a further upside with 0.72570 & 0.73060 as targets.
Comment: RSI below 50 levels and Pair below its 20MA & 55MA.
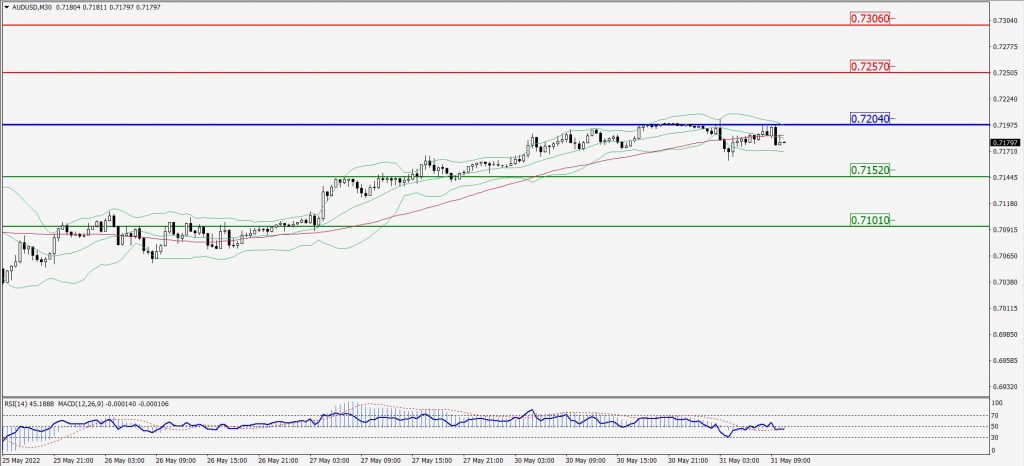
Green Lines Indicate Resistance Levels – Red Lines Indicate Support Levels
Light Blue is a Pivot Point – Black represents the price when the report was produced
CRUDEOIL Intraday: Major Trend on The Upside
Our pivot point is at 116.36
Preferable Price Action: Above pivots buy oil with 119.31 & 121.57 as targets.
Alternative Price Action: Sell crude below pivot with targets at 113.51 and 111.25 in extension.
Comment: MACD is in the positive territory and Pair above its 20MA & 55MA.
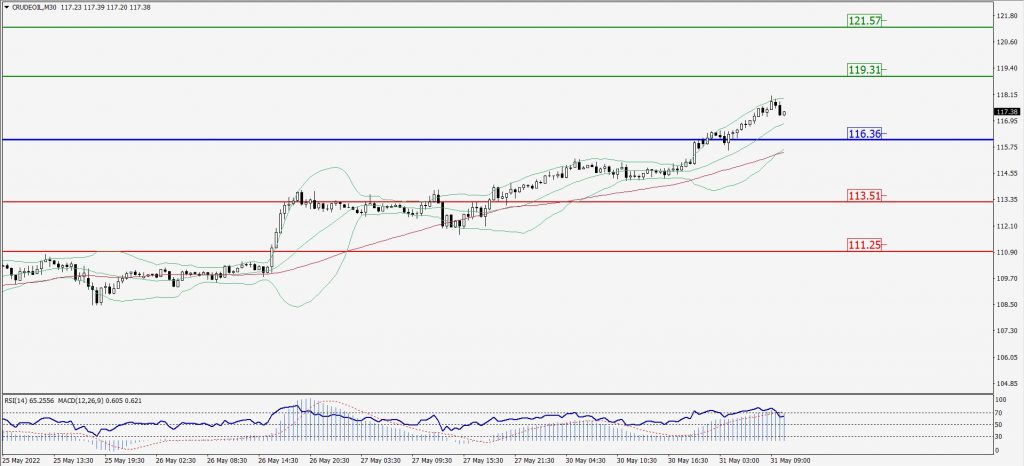
Green Lines Indicate Resistance Levels – Red Lines Indicate Support Levels
Light Blue is a Pivot Point – Black represents the price when the report was produced
XAU/USD Intraday: Support level at 1852.70
Our pivot point is 1852.70
Preferable Price Action: Further upside to 1864.80 and 1874.90
Alternative Price Action: If the price gives a downside breakout of a pivot, then the price extends to 1841.40 and 1831.50.
Comment: MACD is positive territory and pair above 20MA.
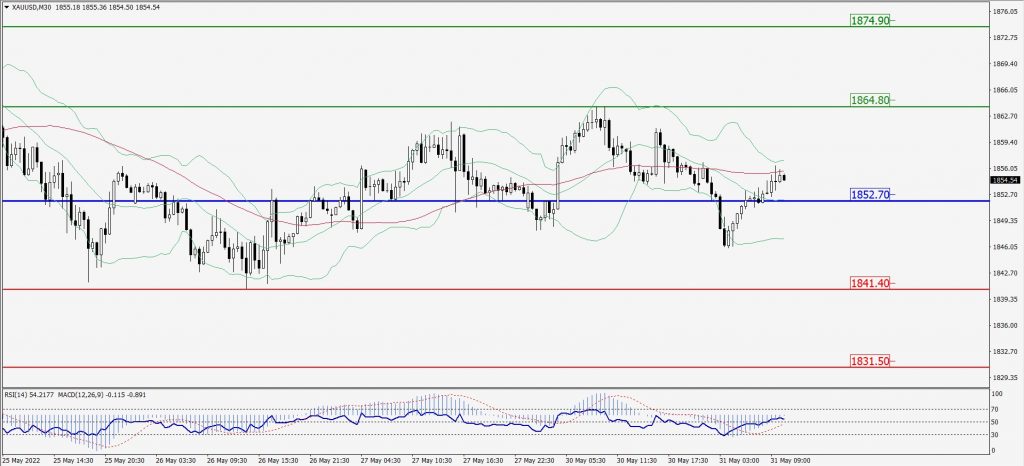
Green Lines Indicate Resistance Levels – Red Lines Indicate Support Levels
Light Blue is a Pivot Point – Black represents the price when the report was produced
Dow Jones Intraday: Trend on the downside
Our pivot point is 33,189.00
Preferable Price Action: Take sell positions below pivot with targets at 32,790.00 & 32,424.00.
Alternative Price Action: Above 33,189.00 looks for further upside to 33,613.00 & 34,021.00.
Comment: RSI below 50 levels and Pair below its 20MA & 55MA.
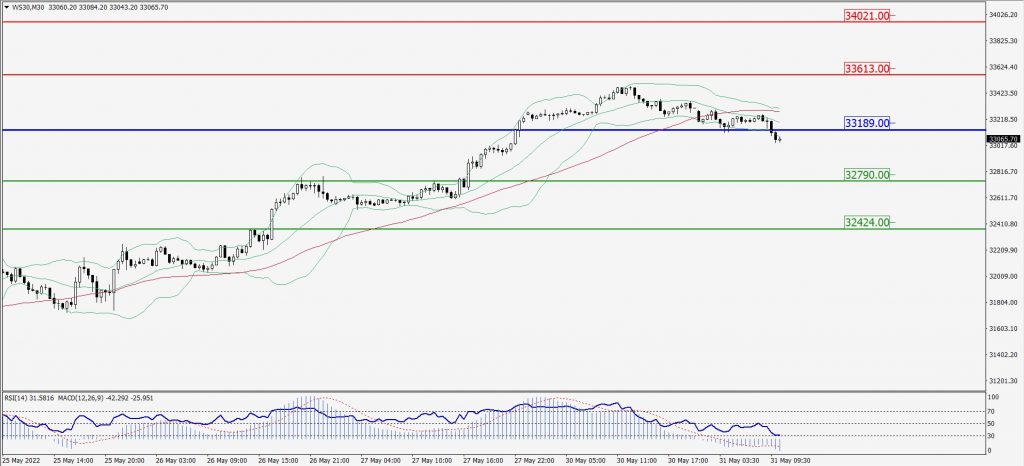
Green Lines Indicate Resistance Levels – Red Lines Indicate Support Levels
Light Blue is a Pivot Point – Black represents the price when the report was produced