Market Wrap: Stocks, Bonds, Commodities
Wall Street’s three major indexes closed lower on Wednesday as investors bet that the latest economic data would do nothing to push the Federal Reserve off track from its aggressive interest rate hiking cycle aimed at taming run-away inflation.
The Dow Jones Industrial Average fell 176.89 points to 32,813.23, the S&P 500 lose 30.92 points to 4,101.23 and the Nasdaq Composite subtract 86.93 points to 11,994.46.
MSCI’s index of Asia-Pacific stocks outside Japan is drop 0.94% to 676.50 levels. Australian index lower 0.80% to 7,175.90. Japanese Nikkei Index drop 0.16% to 27,413.88.
European stocks were positive on Thursday, with the Stoxx Europe 50 Index rose 0.57% to 3,780.15, Germany’s DAX advance 0.64% to 14,430.80, and France’s CAC gain 0.79% to 6,471.32, and U.K.’s FTSE 100 fell 0.98% to 7,532.95.
Benchmark 10-year U.S. Treasury fell as demand for safe assets ascend again, today 10-year bond yields a negative 0.55% to 2.915.
Oil prices fell by around $3 a barrel in early Asian trade on Thursday as investors cashed in on a recent rally with a key producers meeting later in the day set to pave the way for expected output increases.
Spot Brent crude oil subtract 2.34% to $113.63 per barrel. US West Texas Intermediate crude is down 2.22% to $112.67 a barrel.
The yellow metal gold is advance 0.37% to 1,855.45 dollars per ounce.
Market Wrap: Forex
Bearish bets on Asian currencies reduced on signs that China’s economic pain may abate with the easing of COVID-19 curbs, but analysts were still wary of future lockdowns and the direction of U.S. monetary policy, a Reuters poll showed on Thursday.
Today, the U.S. dollar index measures the Greenback against a trade-weighted basket of six major currencies, which is a fell 0.27% to 102.245.
The Euro US Dollar (EUR/USD) is a widely traded pair that is up 0.42% today. This left the pair trading around $1.06900.
The Japanese yen was positive against the U.S. dollar on Thursday as the stock up. Today USD/JPY is fell 0.13% to 129.940 level.
Another commodity-related currency positive against the U.S dollar, AUD/USD gain 0.19% to 0.71890, and NZD/USD up 0.22 to 0.64960 level.
EUR/USD Intraday: Trend on the upside
Our pivot point is at 1.06770
Preferable Price Action: Take buy positions above pivot level with targets at 1.07370 & 1.08000 in extension.
Alternative Price Action: Below pivot looks for a further downside to 1.06190 & 1.05660.
Comment: RSI above 50 levels and Pair above its 20MA & 55MA.
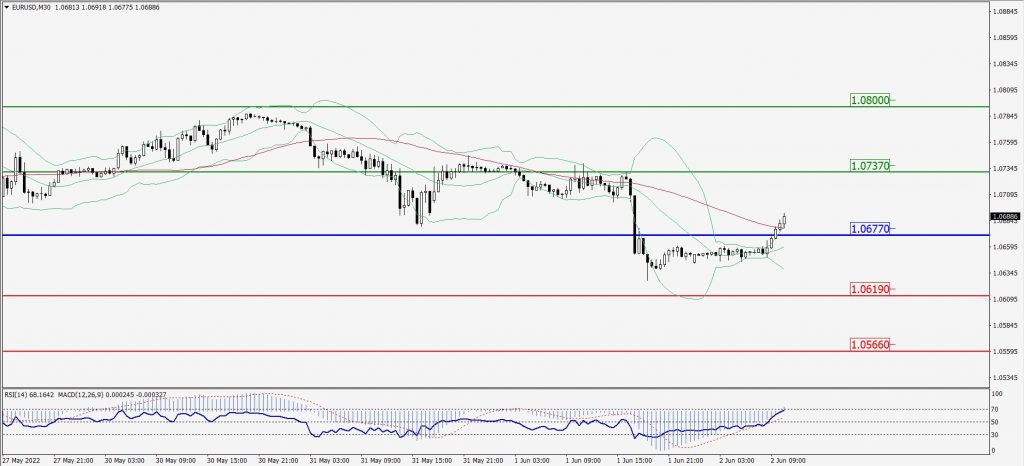
Green Lines Indicate Resistance Levels – Red Lines Indicate Support Levels
Light Blue is a Pivot Point – Black represents the price when the report was produced
GBP/USD Intraday: Trend on the upside
Our pivot point is at 1.25120
Preferable Price Action: Buy positions above pivot with targets at 1.26470 & 1.27600 in extension.
Alternative Price Action: The price below pivot would call for further downside to 1.23900 & 1.22720.
Comment: RSI above 50 levels pair above its 20MA & 55MA.
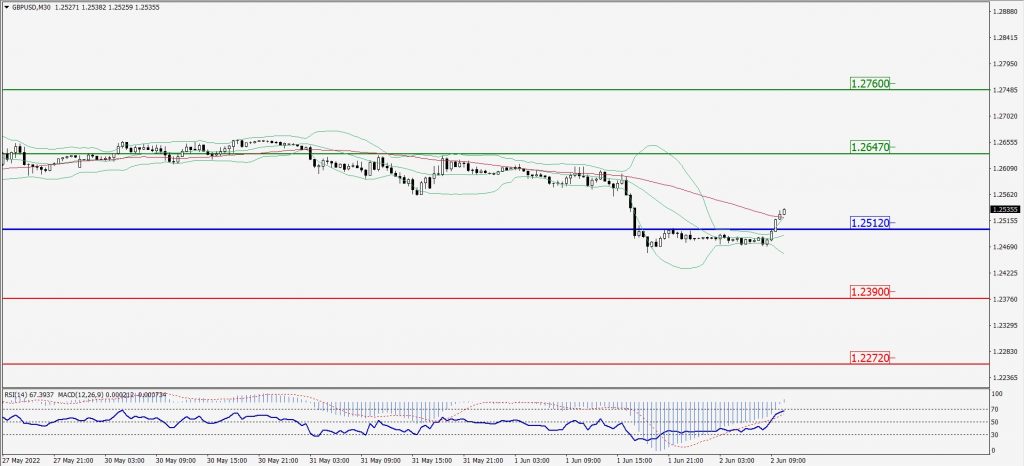
Green Lines Indicate Resistance Levels – Red Lines Indicate Support Levels
Light Blue is a Pivot Point – Black represents the price when the report was produced
USD/JPY Intraday: May trend reverse from 130.450
Our pivot point is at 130.450
Preferable Price Action: Sell position below pivot with the target at 128.980 and 127.800 in extension.
Alternative Price Action: The upside breakout of the pivot would call for 131.700 and 132.800.
Comment: MACD is negative territory and Pair below 20MA.
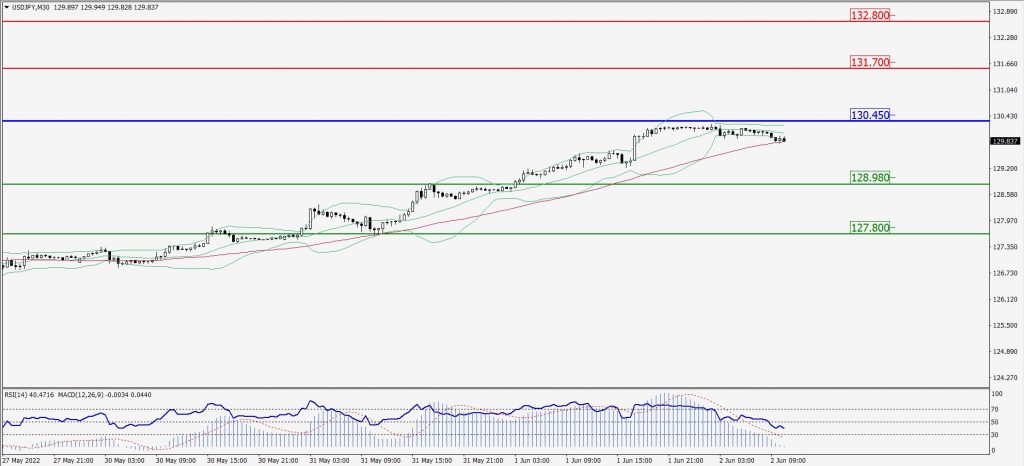
Green Lines Indicate Resistance Levels – Red Lines Indicate Support Levels
Light Blue is a Pivot Point – Black represents the price when the report was produced
AUD/USD Intraday: Major support level at 0.71750
Our pivot point is at 0.71750
Preferable Price Action: Buy Positions above pivot with targets at 0.72410 & 0.73000 in extension.
Alternative Price Action: Below pivot looks for a further downside with 0.71180 & 0.70690 as targets.
Comment: RSI above 50 levels and Pair above 20MA.
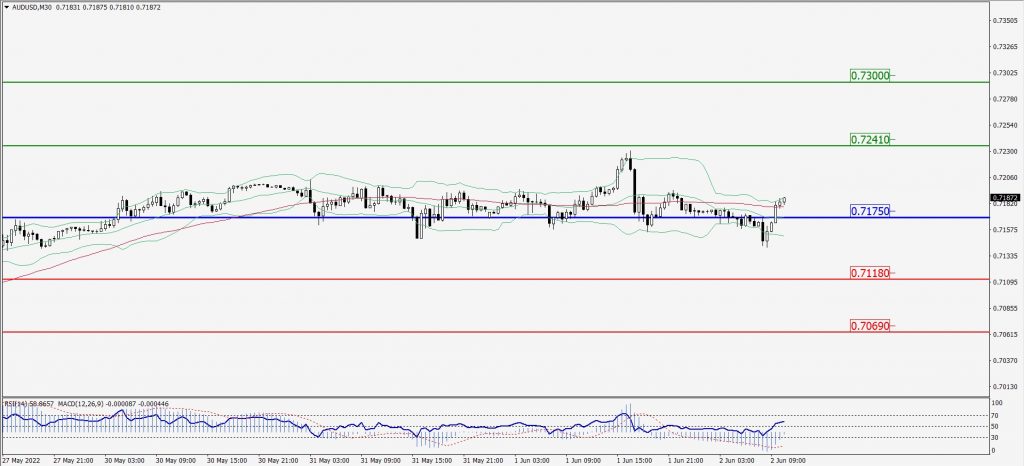
Green Lines Indicate Resistance Levels – Red Lines Indicate Support Levels
Light Blue is a Pivot Point – Black represents the price when the report was produced
CRUDEOIL Intraday: Trend on the downside
Our pivot point is at 113.00
Preferable Price Action: Below pivots sell oil with 108.50 & 105.50 as targets.
Alternative Price Action: Buy crude above pivot with targets at 116.90 and 119.90 in extension.
Comment: MACD is in the negative territory and Pair below its 20MA & 55MA.
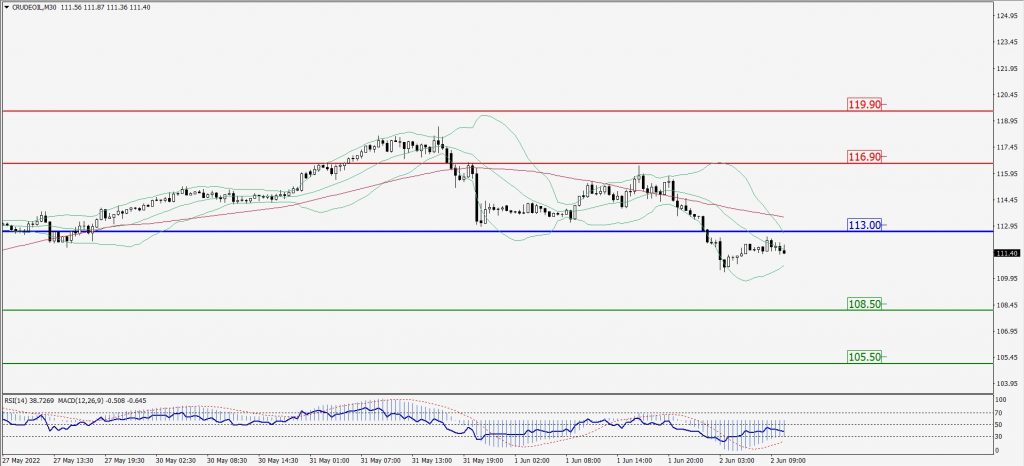
Green Lines Indicate Resistance Levels – Red Lines Indicate Support Levels
Light Blue is a Pivot Point – Black represents the price when the report was produced
XAU/USD Intraday: In a consolidation zone
Our pivot point is 1850.20
Preferable Price Action: Further upside to 1868.00 and 1879.70
Alternative Price Action: If the price gives a downside breakout of a pivot, then the price extends to 1835.40 and 1822.30.
Comment: MACD is positive territory and pair above its 20Ma & 55MA.
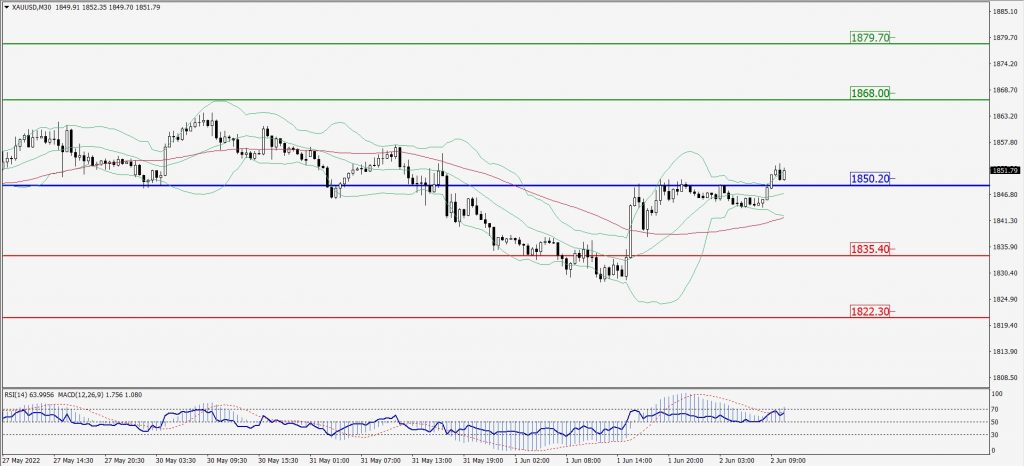
Green Lines Indicate Resistance Levels – Red Lines Indicate Support Levels
Light Blue is a Pivot Point – Black represents the price when the report was produced
Dow Jones Intraday: In a consolidation zone
Our pivot point is 32,994.00
Preferable Price Action: Take sell positions below pivot with targets at 32,535.00 & 32,178.00.
Alternative Price Action: above 32,994.00 looks for further upside to 33,450.00 & 33,778.00.
Comment: RSI at 50 levels and Pair below 55MA.
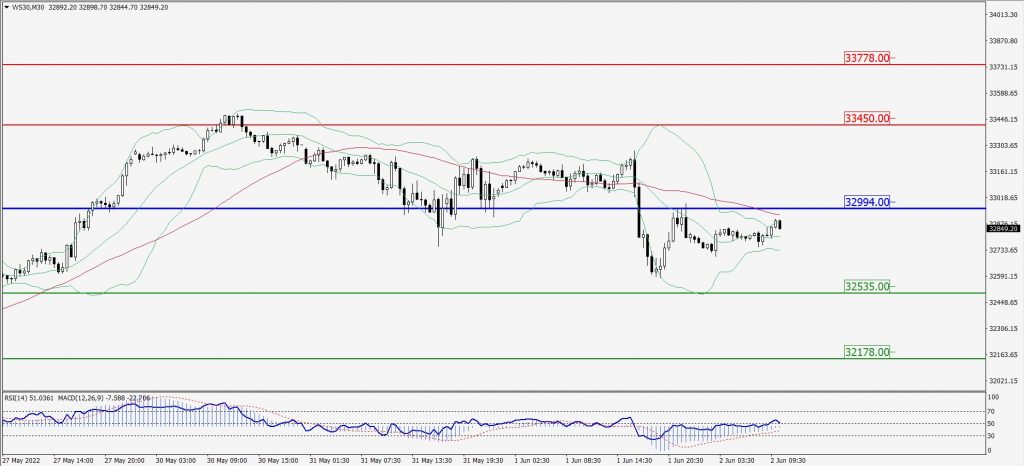
Green Lines Indicate Resistance Levels – Red Lines Indicate Support Levels
Light Blue is a Pivot Point – Black represents the price when the report was produced