Market Wrap: Stocks, Bonds, Commodities
US stocks ended on May 5 sharply lower amid a broad sell-off, as investor sentiment cratered in the face of concerns that the Federal Reserve’s interest rate hike the previous day would not be enough to tame surging inflation.
The S&P 500 lose (3.56%) ended at 4,146.87 points, while the Nasdaq Composite down 4.99% to 12,317.69. The Dow Jones Industrial was fell 3.12% to 32,997.97.
MSCI’s index of Asia-Pacific stocks outside Japan is drop 2.74% to 658.65 levels. Australian index lower 2.16% to 7,205.60. Japanese Nikkei Index surge 0.69% to 27,003.56.
European stocks were negative on Friday, with the Stoxx Europe 50 Index lose 0.92% to 3,662.45, Germany’s DAX drop 0.79% to 13,792.52, and France’s CAC down 1.02% to 6,303.13, and U.K.’s FTSE 100 decrease 0.65% to 7,454.50.
Benchmark 10-year U.S. Treasury fell as demand for safe assets ascend again, today 10-year bond yields a positive 3.0730.
Oil prices dipped at the start of Asian trade on May 6 as worries about an economic downturn that could dampen demand for crude vied with concerns over new sanctions from the European Union against Russia, including an embargo on crude oil.
Spot Brent crude oil rose 0.69% to $111.67 per barrel. US West Texas Intermediate crude is up 0.64% to $108.95 a barrel.
The yellow metal gold is advance 0.12% to 1,878.03 dollars per ounce.
Market Wrap: Forex
The U.S. dollar soared in early European trade Friday, climbing to its highest level in two decades ahead of the release of the closely watched monthly U.S. jobs report which could pave the wave for further monetary policy tightening.
Today, the U.S. dollar index measures the Greenback against a trade-weighted basket of six major currencies, which is a fell of 0.14% to 103.660.
The Euro US Dollar (EUR/USD) is a widely traded pair that is up 0.04% today. This left the pair trading around $1.05440.
The Japanese yen was positive against the U.S. dollar on Friday as the stock up. Today USD/JPY is rose 0.29% to 130.510 level.
Another commodity-related currency negative against the U.S dollar, AUD/USD drop 0.29 to 0.70910, and NZD/USD lower 0.14% to 0.64180 level.
EUR/USD Intraday: Trend on The Downside
Our pivot point is at 1.05290
Preferable Price Action: Take Sell positions below pivot level with targets at 1.04400 & 1.03630 in extension.
Alternative Price Action: Above pivot looks for a further upside to 1.06220 & 1.07040.
Comment: RSI Below 50 levels and Pair below its 20MA & 55MA.
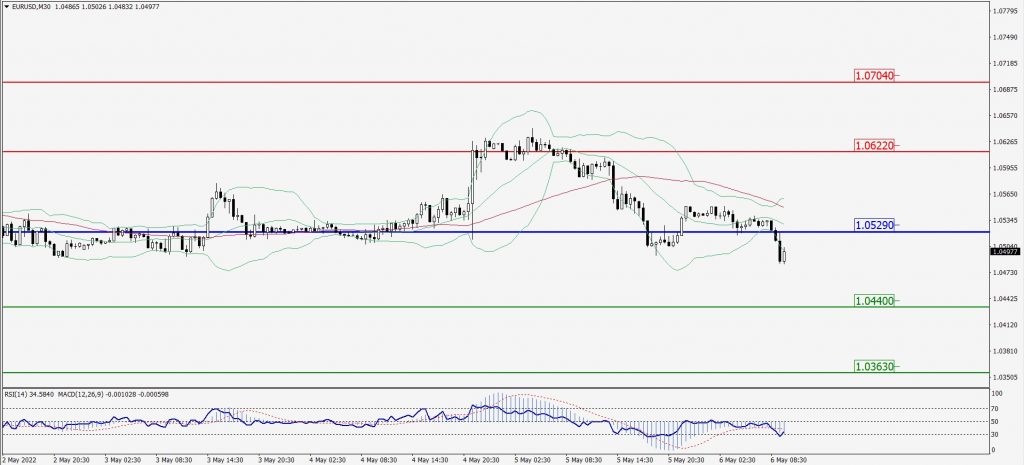
Green Lines Indicate Resistance Levels – Red Lines Indicate Support Levels
Light Blue is a Pivot Point – Black represents the price when the report was produced
GBP/USD Intraday: Trend on The Downside
Our pivot point is at 1.23910
Preferable Price Action: Sell positions below pivot with targets at 1.22120 & 1.20730 in extension.
Alternative Price Action: The price above pivot would call for further upside to 1.25640 & 1.27020.
Comment: RSI below 50 levels pair below its 20MA & 55MA.
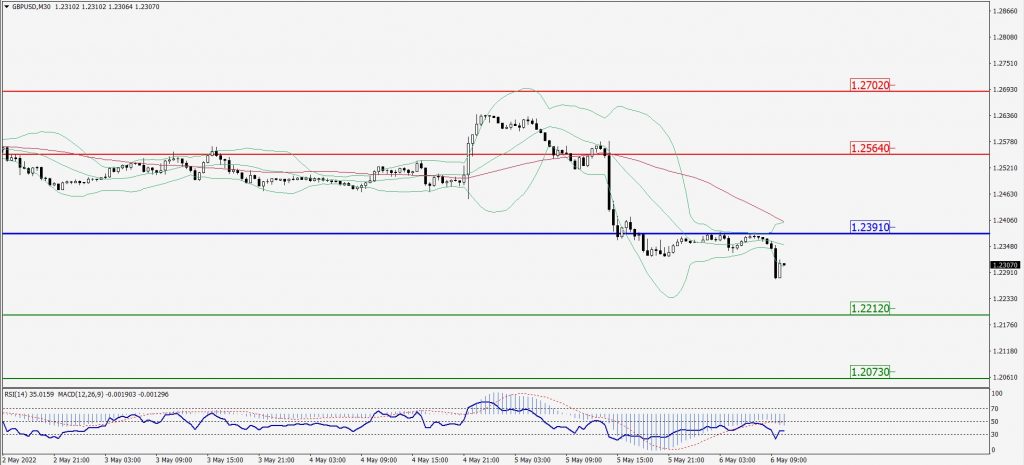
Green Lines Indicate Resistance Levels – Red Lines Indicate Support Levels
Light Blue is a Pivot Point – Black represents the price when the report was produced
USD/JPY Intraday: In a Consolidation Zone
Our pivot point is at 130.920
Preferable Price Action: Sell position below pivot with the target at 129.700 and 128.460 in extension.
Alternative Price Action: The upside breakout of the pivot would call for 132.060 and 133.060.
Comment: MACD is flat territory and pair below 20MA.
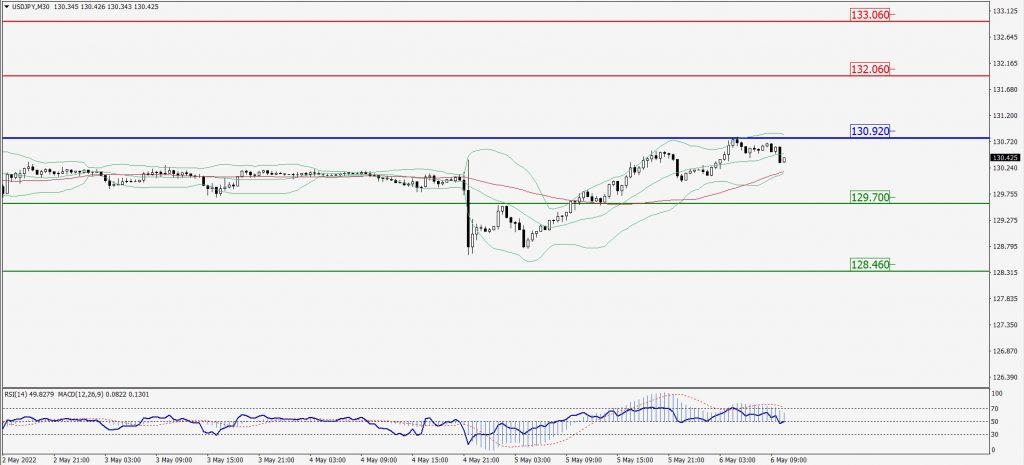
Green Lines Indicate Resistance Levels – Red Lines Indicate Support Levels
Light Blue is a Pivot Point – Black represents the price when the report was produced
AUD/USD Intraday: Major Trend on The Downside
Our pivot point is at 0.71200
Preferable Price Action:Sell Positions below pivot with targets at 0.69940 & 0.68950 in extension.
Alternative Price Action: Above pivot looks for a further upside with 0.72410 & 0.73400 as targets.
Comment: RSI below 50 levels and Pair below its 20MA & 55MA.
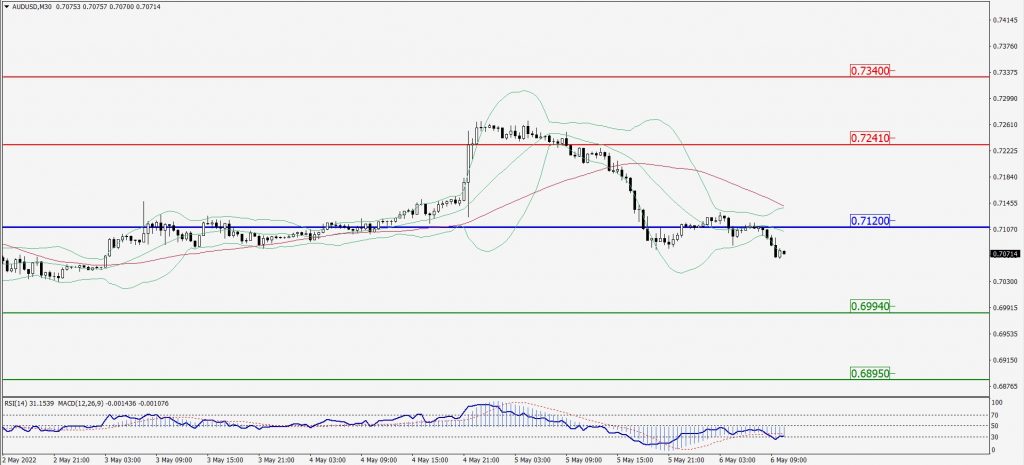
Green Lines Indicate Resistance Levels – Red Lines Indicate Support Levels
Light Blue is a Pivot Point – Black represents the price when the report was produced
CRUDEOIL Intraday: Major Trend on The Upside
Our pivot point is at 106.50
Preferable Price Action: Above pivots buy oil with 110.90 & 114.60 as targets.
Alternative Price Action: Sell crude below pivot with targets at 102.30 and 98.90 in extension.
Comment: MACD is in the flat territory and Pair above 55MA.
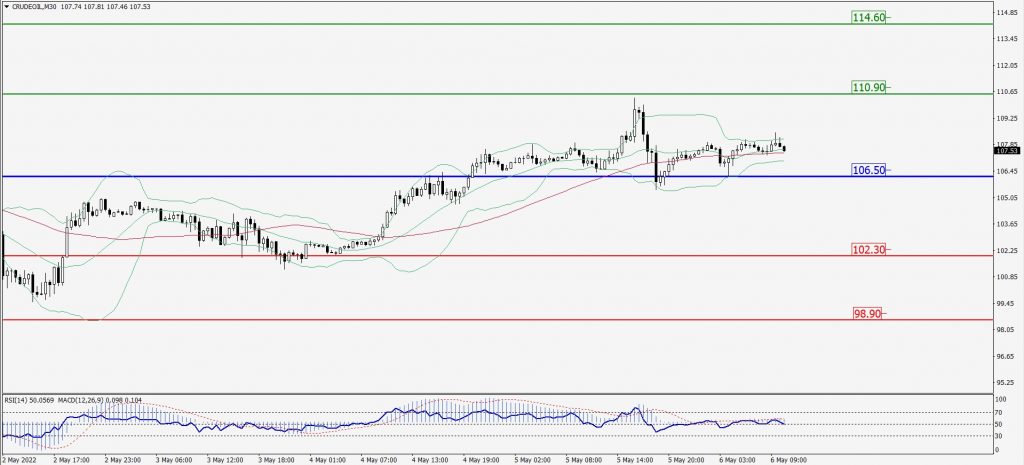
Green Lines Indicate Resistance Levels – Red Lines Indicate Support Levels
Light Blue is a Pivot Point – Black represents the price when the report was produced
XAU/USD Intraday: In a Consolidation Zone
Our pivot point is 1884.40
Preferable Price Action: Further downside to 1858.70 and 1837.80.
Alternative Price Action: If the price gives an upside breakout of a pivot, then the price extends to 1907.60 and 1928.60.
Comment: MACD is negative territory and Pair below 55MA.
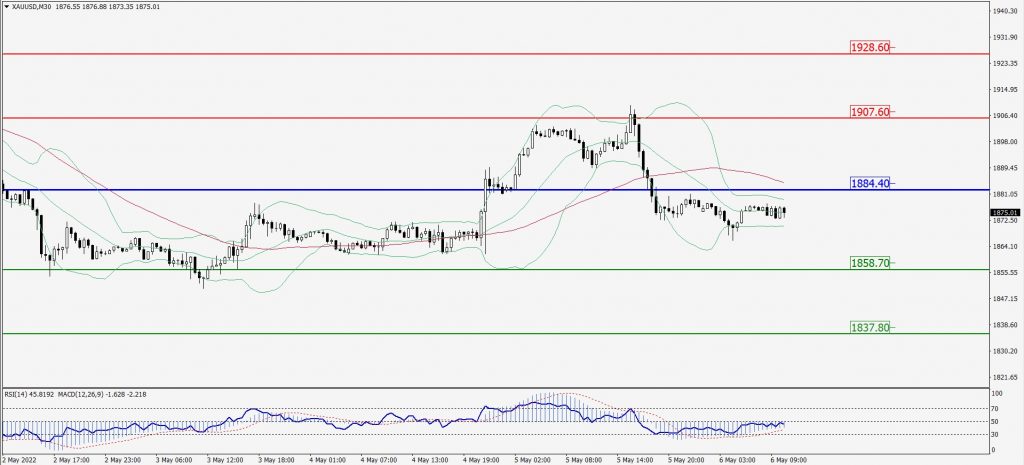
Green Lines Indicate Resistance Levels – Red Lines Indicate Support Levels
Light Blue is a Pivot Point – Black represents the price when the report was produced
Dow Jones Intraday: Major Trend on The Downside
Our pivot point is 33,234.00
Preferable Price Action: Take Sell positions below pivot with targets at 31,821.00 & 30,743.00.
Alternative Price Action: Above 33,234.00 looks for further upside to 34,541.00 & 35,541.00.
Comment: RSI above 50 levels and pair above 55MA.
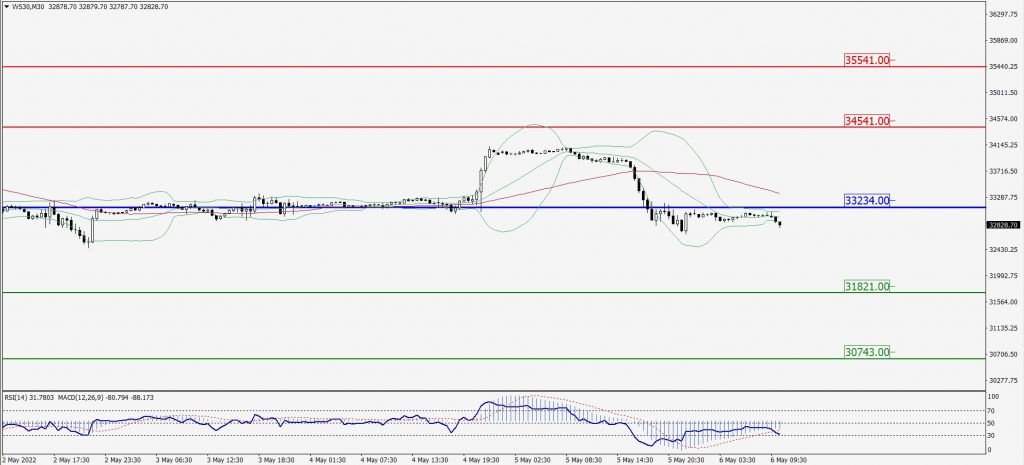
Green Lines Indicate Resistance Levels – Red Lines Indicate Support Levels
Light Blue is a Pivot Point – Black represents the price when the report was produced