Market Wrap: Stocks, Bonds, Commodities
US stocks ended sharply higher on Wednesday after the Federal Reserve delivered a widely expected interest-rate hike, and the S&P 500 recorded its biggest one-day percentage gain in nearly two years.
The S&P 500 gain (2.99%) ended at 4,300.17 points, while the Nasdaq Composite up 3.19% to 12,964.86. The Dow Jones Industrial was rose 2.81% to 34,061.06.
MSCI’s index of Asia-Pacific stocks outside Japan is ascend 0.30% to 681.05 levels. Australian index higher 0.82% to 7,364.70. Japanese Nikkei Index slipped 0.11% to 26,818.53.
European stocks were positive on Thursday, with the Stoxx Europe 50 Index gain 1.57% to 3,782.45, Germany’s DAX ascend 1.68% to 14,206.50, and France’s CAC up 1.78% to 6,509.34, and U.K.’s FTSE 100 increase 1.27% to 7,586.13.
Benchmark 10-year U.S. Treasury fell as demand for safe assets ascend again, today 10-year bond yields a positive 2.9660.
Oil prices edged higher at the start of Asian trade on Thursday, extending gains from the previous session, after the European Union proposed new sanctions against Russia that included an embargo on crude oil in six months.
Spot Brent crude oil rose 0.31% to $110.47 per barrel. US West Texas Intermediate crude is up 0.12% to $107.97 a barrel.
The yellow metal gold is advance 1.42% to 1,895.30 dollars per ounce.
Market Wrap: Forex
The U.S. dollar was nursing its losses at a one-week low on Thursday after the U.S. Federal Reserve raised interest rates as widely expected but poured cold water on the idea that even larger hikes could lie ahead.
Today, the U.S. dollar index measures the Greenback against a trade-weighted basket of six major currencies, which is a rose of 0.25% to 102.850.
The Euro US Dollar (EUR/USD) is a widely traded pair that is down 0.24% today. This left the pair trading around $1.05950.
The Japanese yen was positive against the U.S. dollar on Thursday as the stock up. Today USD/JPY is rose 0.46% to 129.680 level.
Another commodity-related currency negative against the U.S dollar, AUD/USD drop 0.53 to 0.72220, and NZD/USD lower 0.49% to 0.65110 level.
EUR/USD Intraday: May Trend Reverse From 1.05780
Our pivot point is at 1.05780
Preferable Price Action: Take Buy positions above pivot level with targets at 1.06630 & 1.07390 in extension.
Alternative Price Action: Below pivot looks for a further downside to 1.04820 & 1.04080.
Comment: RSI Above 50 levels and Pair above 55MA.
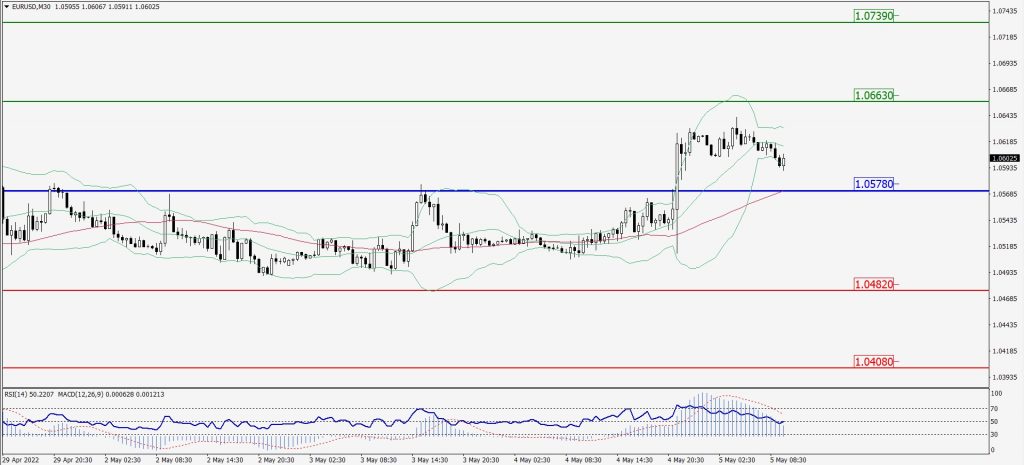
Green Lines Indicate Resistance Levels – Red Lines Indicate Support Levels
Light Blue is a Pivot Point – Black represents the price when the report was produced
GBP/USD Intraday: Trend on The Downside
Our pivot point is at 1.26800
Preferable Price Action: Sell positions below pivot with targets at 1.24430 & 1.23240 in extension.
Alternative Price Action: The price above pivot would call for further upside to 1.27030 & 1.28100.
Comment: RSI below 50 levels pair below its 20MA & 55MA.
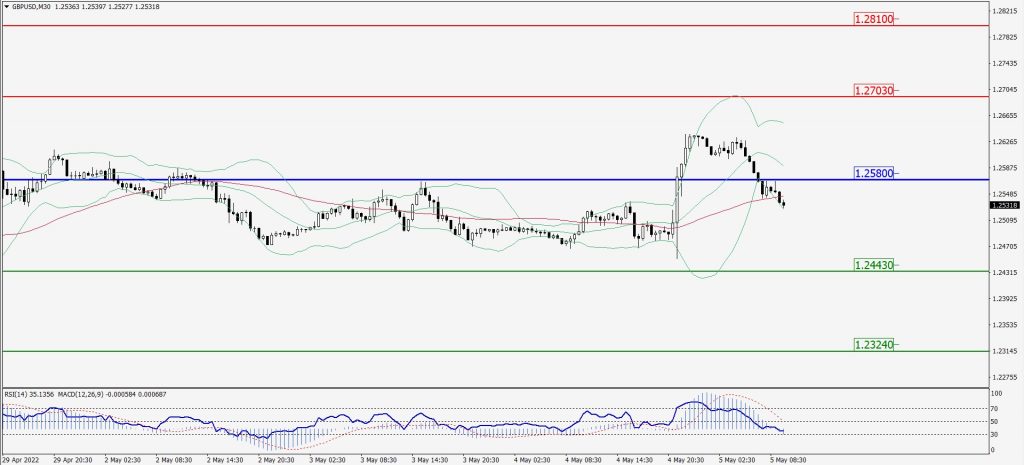
Green Lines Indicate Resistance Levels – Red Lines Indicate Support Levels
Light Blue is a Pivot Point – Black represents the price when the report was produced
USD/JPY Intraday: Trend on The Upside
Our pivot point is at 129.430
Preferable Price Action: Buy position above pivot with the target at 130.420 and 131.150 in extension.
Alternative Price Action: The downside breakout of the pivot would call for 128.650 and 128.000.
Comment: MACD is above territory and pair above 20MA.
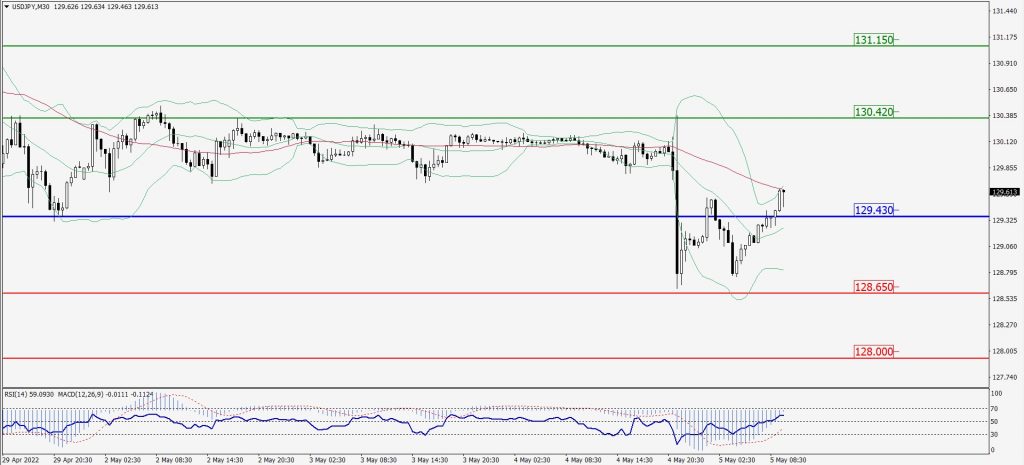
Green Lines Indicate Resistance Levels – Red Lines Indicate Support Levels
Light Blue is a Pivot Point – Black represents the price when the report was produced
AUD/USD Intraday: Major Resistance Level at 0.72430
Our pivot point is at 0.72430
Preferable Price Action:Sell Positions below pivot with targets at 0.71660 & 0.70980 in extension.
Alternative Price Action: Above pivot looks for a further upside with 0.73170 & 0.73720 as targets.
Comment: RSI below 50 levels and Pair below 20MA.
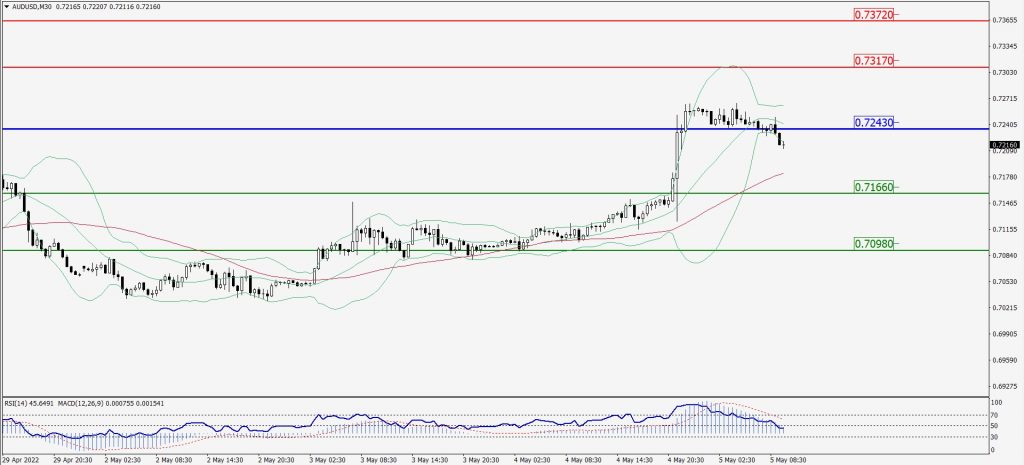
Green Lines Indicate Resistance Levels – Red Lines Indicate Support Levels
Light Blue is a Pivot Point – Black represents the price when the report was produced
CRUDEOIL Intraday: Major Trend on The Upside
Our pivot point is at 105.40
Preferable Price Action: Above pivots buy oil with 109.70 & 113.00 as targets.
Alternative Price Action: Sell crude below pivot with targets at 101.40 and 98.00 in extension.
Comment: MACD is in the flat territory and Pair above 55MA.
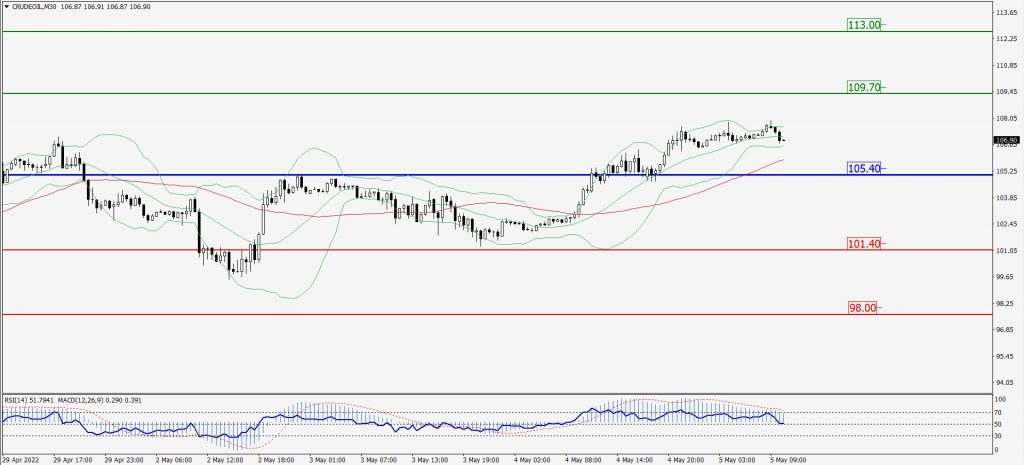
Green Lines Indicate Resistance Levels – Red Lines Indicate Support Levels
Light Blue is a Pivot Point – Black represents the price when the report was produced
XAU/USD Intraday: In a Consolidation Zone
Our pivot point is 1889.40
Preferable Price Action: Further upside to 1911.70 and 1931.50.
Alternative Price Action: If the price gives a downside breakout of a pivot, then the price extends to 1868.70 and 1847.80.
Comment: MACD is positive territory and Pair above 55MA.
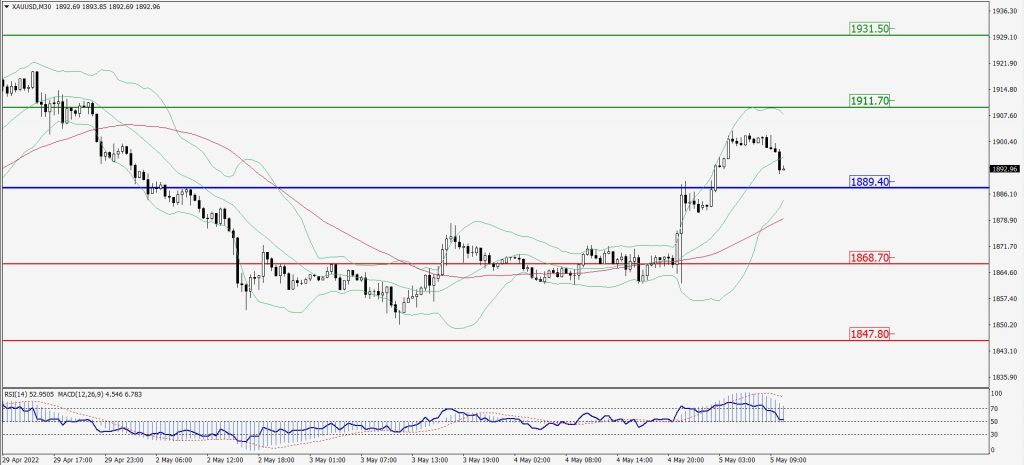
Green Lines Indicate Resistance Levels – Red Lines Indicate Support Levels
Light Blue is a Pivot Point – Black represents the price when the report was produced
Dow Jones Intraday: In a Consolidation Zone
Our pivot point is 33,764.00
Preferable Price Action: Take Buy positions above pivot with targets at 34,579.00 & 35,145.00.
Alternative Price Action: Below 33,764.00 looks for further downside to 33,010.00 & 32,389.00.
Comment: RSI above 50 levels and pair above 55MA.
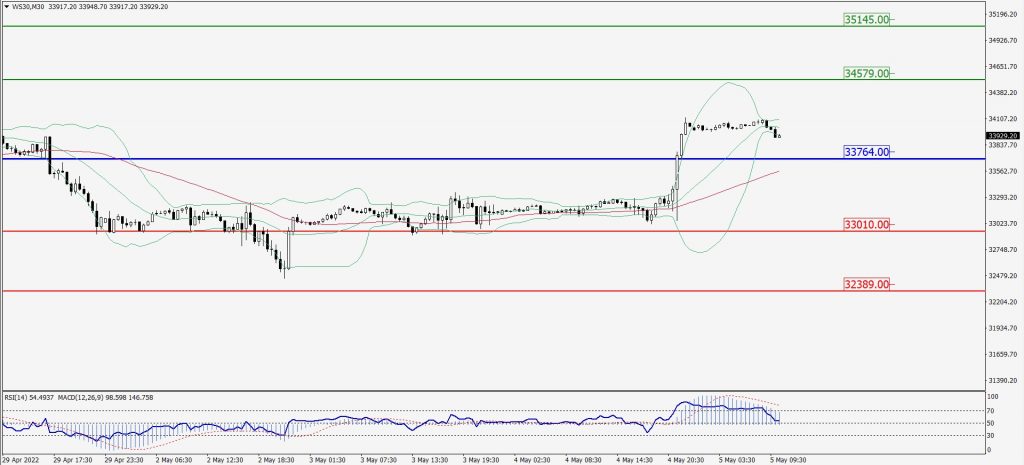
Green Lines Indicate Resistance Levels – Red Lines Indicate Support Levels
Light Blue is a Pivot Point – Black represents the price when the report was produced