Market Wrap: Stocks, Bonds, Commodities
Wall Street stocks ended higher on Tuesday after a choppy session in which each of the major indexes fluctuated between gains and losses as a key meeting of the Federal Reserve got under way.
The S&P 500 gain (0.48%) ended at 4,175.48 points, while the Nasdaq Composite up 0.22% to 12,563.76. The Dow Jones Industrial was rose 0.20% to 33,128.79.
MSCI’s index of Asia-Pacific stocks outside Japan is drop 0.70% to 678.68 levels. Australian index lower 0.16% to 7,304.70. Japanese Nikkei Index slipped 0.11% to 26,818.53.
European stocks were negative on Wednesday, with the Stoxx Europe 50 Index lose 0.17% to 3,754.05, Germany’s DAX drop 0.08% to 14,034.00, and France’s CAC down 0.13% to 6,467.34, and U.K.’s FTSE 100 decrease 0.28% to 7,539.35.
Benchmark 10-year U.S. Treasury fell as demand for safe assets ascend again, today 10-year bond yields positive 2.9660.
Oil prices rose at the start of Asian trade on Wednesday after industry data showed drawdowns in US crude and fuel stockpiles, raising supply concerns.
Spot Brent crude oil rose 2.85% to $107.96 per barrel. US West Texas Intermediate crude is up 2.99% to $105.44 a barrel.
The yellow metal gold is advance 0.04% to 1,871.70 dollars per ounce.
Market Wrap: Forex
The U.S. dollar edged lower in early European trade Wednesday ahead of the latest Federal Reserve interest rate decision, with caution ahead of the event resulting in tight trading ranges.
Today, the U.S. dollar index measures the Greenback against a trade-weighted basket of six major currencies, which is a fell of 0.02% to 103.480.
The Euro US Dollar (EUR/USD) is a widely traded pair that is up 0.04% today. This left the pair trading around $1.05240.
The Japanese yen was positive against the U.S. dollar on Wednesday as the stock up. Today USD/JPY is rose 0.02% to 130.120 level.
Another commodity-related currency positive against the U.S dollar, AUD/USD ascend 0.18 to 0.71070, and NZD/USD higher 0.02% to 0.64370 level.
EUR/USD Intraday: Major Resistance Level at 1.05380
Our pivot point is at 1.05380
Preferable Price Action: Take Sell positions below pivot level with targets at 1.04560 & 1.03980 in extension.
Alternative Price Action: Above pivot looks for a further upside to 1.06090 & 1.06730.
Comment: RSI at 50 levels and Pair below 55MA.
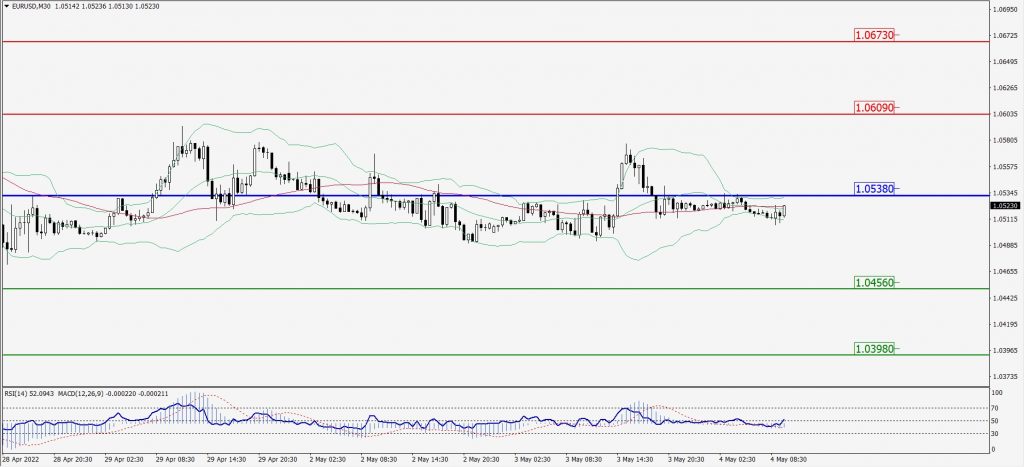
Green Lines Indicate Resistance Levels – Red Lines Indicate Support Levels
Light Blue is a Pivot Point – Black represents the price when the report was produced
GBP/USD Intraday: In a Consolidation Zone
Our pivot point is at 1.24650
Preferable Price Action: Buy positions above pivot with targets at 1.26200 & 1.27320 in extension.
Alternative Price Action: The price below pivot would call for further downside to 1.23510 & 1.22560.
Comment: RSI above 50 levels.
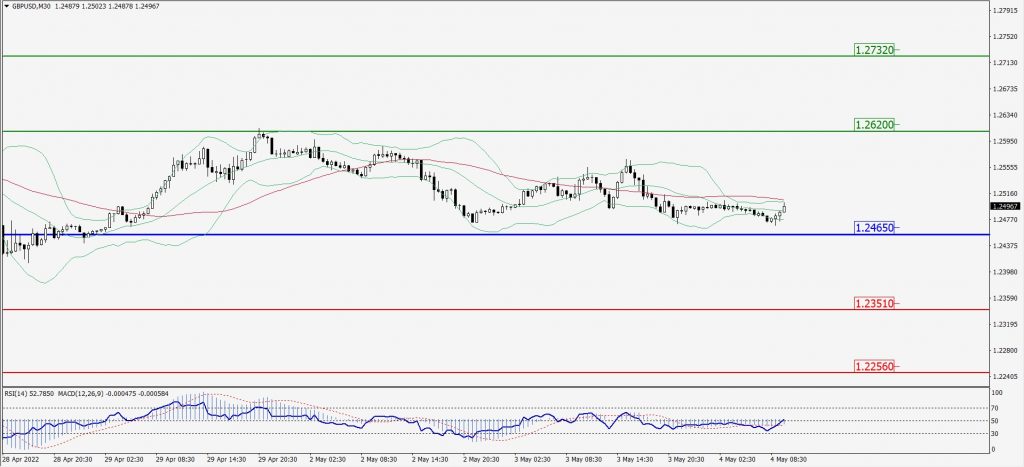
Green Lines Indicate Resistance Levels – Red Lines Indicate Support Levels
Light Blue is a Pivot Point – Black represents the price when the report was produced
USD/JPY Intraday: In a Consolidation Zone
Our pivot point is at 129.940
Preferable Price Action: Buy position above pivot with the target at 130.750 and 131.410 in extension.
Alternative Price Action: The downside breakout of the pivot would call for 129.280 and 128.750.
Comment: MACD is above territory and pair above 55MA.
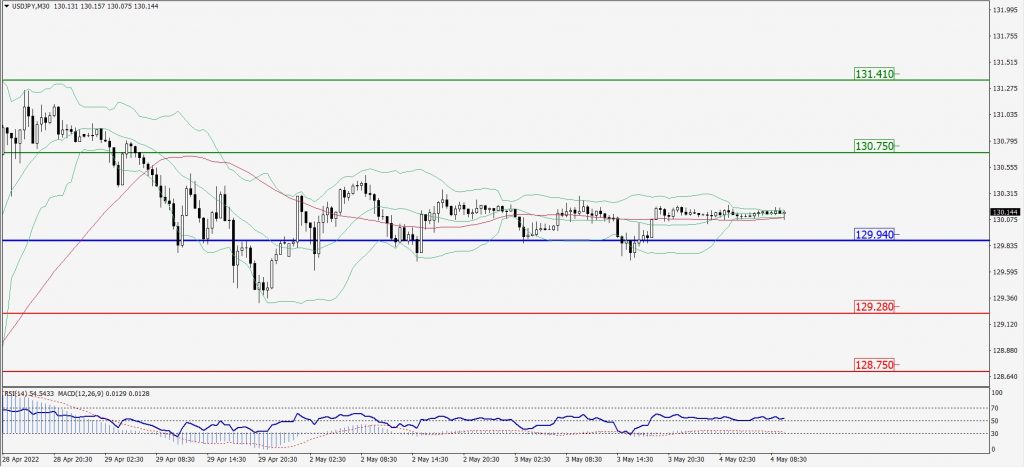
Green Lines Indicate Resistance Levels – Red Lines Indicate Support Levels
Light Blue is a Pivot Point – Black represents the price when the report was produced
AUD/USD Intraday: Trend on The Upside
Our pivot point is at 0.71010
Preferable Price Action: Buy Positions above pivot with targets at 0.71490 & 0.71830 in extension.
Alternative Price Action: Below pivot looks for a further downside with 0.70590 & 0.70280 as targets.
Comment: RSI above 50 levels and Pair above its 20MA & 55MA.
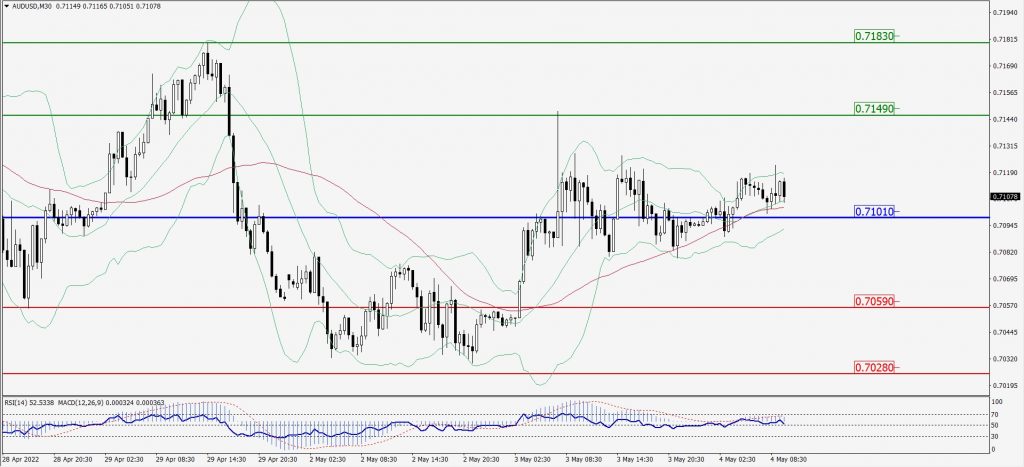
Green Lines Indicate Resistance Levels – Red Lines Indicate Support Levels
Light Blue is a Pivot Point – Black represents the price when the report was produced
CRUDEOIL Intraday: Major Trend on The Upside
Our pivot point is at 103.07
Preferable Price Action: Above pivots buy oil with 107.81 & 111.41 as targets.
Alternative Price Action: Sell crude below pivot with targets at 98.49 and 95.16 in extension.
Comment: MACD is in the positive territory and Pair above its 20MA & 55MA.
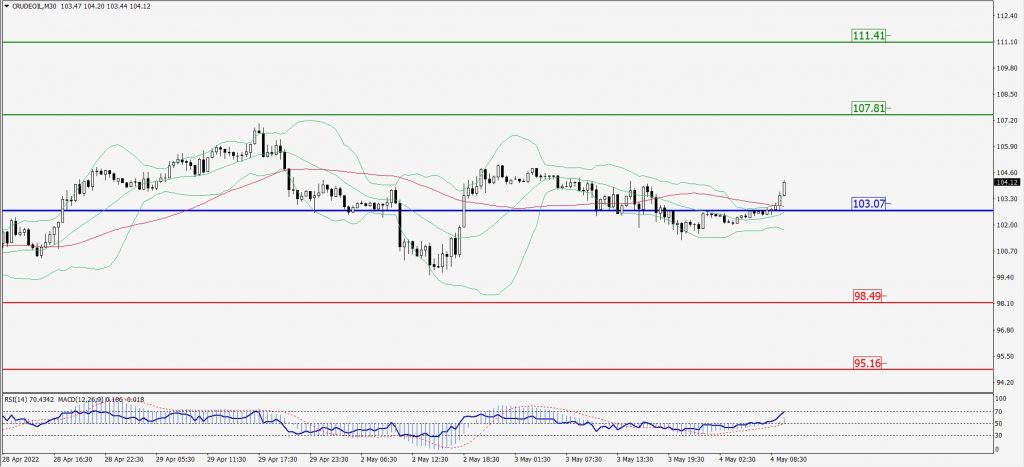
Green Lines Indicate Resistance Levels – Red Lines Indicate Support Levels
Light Blue is a Pivot Point – Black represents the price when the report was produced
XAU/USD Intraday: Trend on The Upside
Our pivot point is 1862.20
Preferable Price Action: Further upside to 1887.40 and 1904.10.
Alternative Price Action: If the price gives a downside breakout of a pivot, then the price extends to 1842.80 and 1825.40.
Comment: MACD is positive territory and Pair above its 20MA & 55MA.
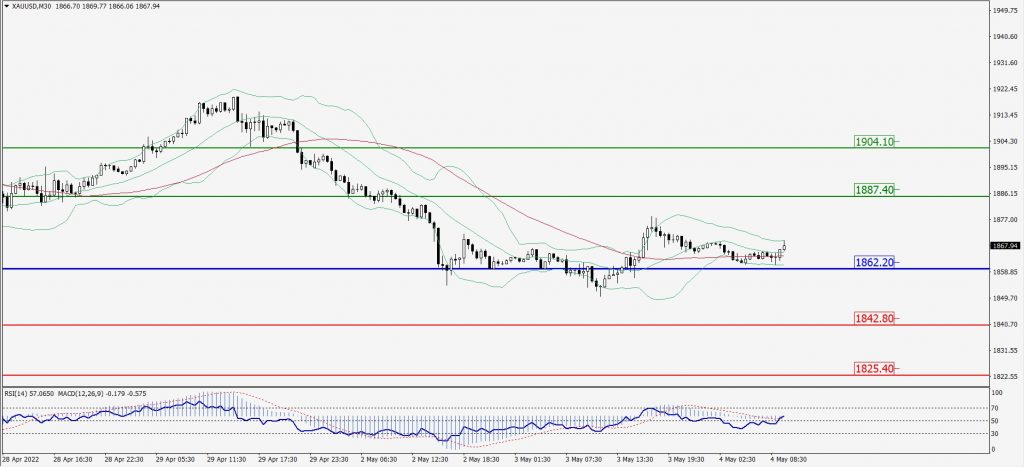
Green Lines Indicate Resistance Levels – Red Lines Indicate Support Levels
Light Blue is a Pivot Point – Black represents the price when the report was produced
Dow Jones Intraday: In a Consolidation Zone
Our pivot point is 33,040.00
Preferable Price Action: Take Buy positions above pivot with targets at 33,387.00 & 33,679.00.
Alternative Price Action: Below 33,040.00 looks for further downside to 32,745.00 & 32,503.00.
Comment: RSI at 50 levels and pair above 55MA.
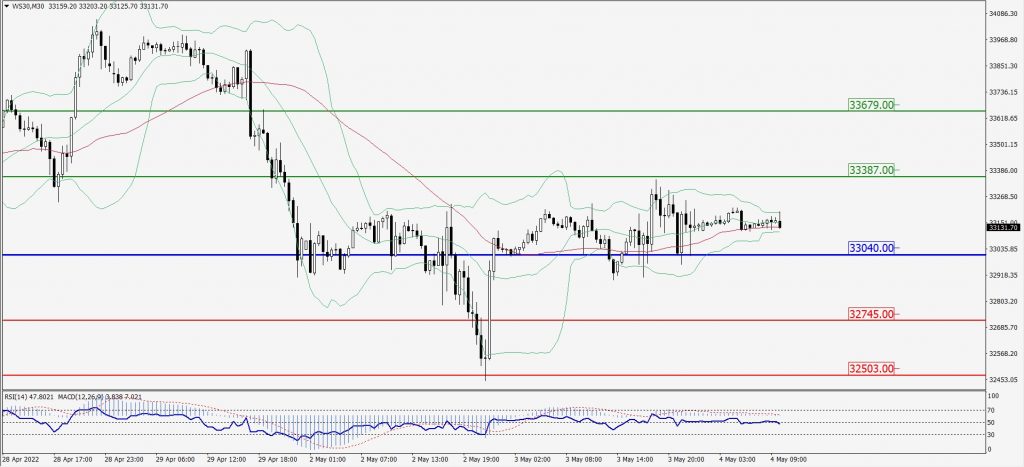
Green Lines Indicate Resistance Levels – Red Lines Indicate Support Levels
Light Blue is a Pivot Point – Black represents the price when the report was produced