Market Wrap: Stocks, Bonds, Commodities
The Biden administration will allocate more than $3 billion in infrastructure funding to finance the electric vehicle (EV) battery manufacturing, U.S. officials said on Tuesday.
The S&P 500 gain (0.57%) ended at 4,155.38 points, while the Nasdaq Composite up 1.63% to 12,536.02. The Dow Jones Industrial was rose 0.26% to 33,061.50.
MSCI’s index of Asia-Pacific stocks outside Japan is drop 0.30% to 683.50 levels. Australian index lower 0.42% to 7,316.20. Japanese Nikkei Index slipped 0.11% to 26,818.53.
European stocks were positive on Tuesday, with the Stoxx Europe 50 Index gain 1.07% to 3,771.35, Germany’s DAX ascend 0.90% to 13,966.00, and France’s CAC up 1.18% to 6,501.34, and U.K.’s FTSE 100 decrease 0.17% to 7,532.70.
Benchmark 10-year U.S. Treasury fell as demand for safe assets ascend again, today 10-year bond yields positive 3.0010.
Oil was down on Tuesday morning in Asia, extending its gains from the previous session. The European Union moved ahead with its plans to tighten sanctions on Russia as the week began, with Germany saying it was prepared to back an immediate embargo on Russian oil.
Spot Brent crude oil fell 0.64% to $106.89 per barrel. US West Texas Intermediate crude is down 0.60% to $104.53 a barrel.
The yellow metal gold is decline 0.39% to 1,856.40 dollars per ounce.
Market Wrap: Forex
Australia’s central bank increased interest rates by more than economists had anticipated and signaled further hikes to come, reflecting a greater urgency to rein in surging inflation.
Today, the U.S. dollar index measures the Greenback against a trade-weighted basket of six major currencies, which is a fell of 0.31% to 103.450.
The Euro US Dollar (EUR/USD) is a widely traded pair that is up 0.20% today. This left the pair trading around $1.05250.
The Japanese yen was positive against the U.S. dollar on Tuesday as the stock up. Today USD/JPY is rose 0.05% to 130.200 level.
Another commodity-related currency positive against the U.S dollar, AUD/USD ascend 0.90 to 0.71100, and NZD/USD higher 0.03% to 0.64300 level.
EUR/USD Intraday: Major Resistance Level at 1.05320
Our pivot point is at 1.05320
Preferable Price Action: Take Sell positions below pivot level with targets at 1.04560 & 1.03980 in extension.
Alternative Price Action: Above pivot looks for a further upside to 1.06090 & 1.09730.
Comment: RSI below 50 levels and Pair below its 20MA & 55MA.
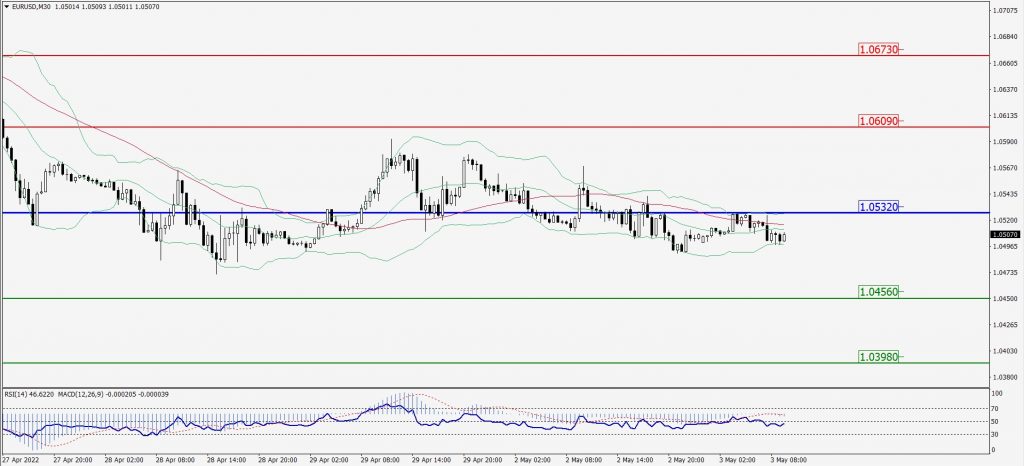
Green Lines Indicate Resistance Levels – Red Lines Indicate Support Levels
Light Blue is a Pivot Point – Black represents the price when the report was produced
GBP/USD Intraday: In a Consolidation Zone
Our pivot point is at 1.25020
Preferable Price Action: Buy positions above pivot with targets at 1.26530 & 1.27710 in extension.
Alternative Price Action: The price below pivot would call for further downside to 1.23800 & 1.22830.
Comment: RSI above 50 levels and Pair above 20MA.
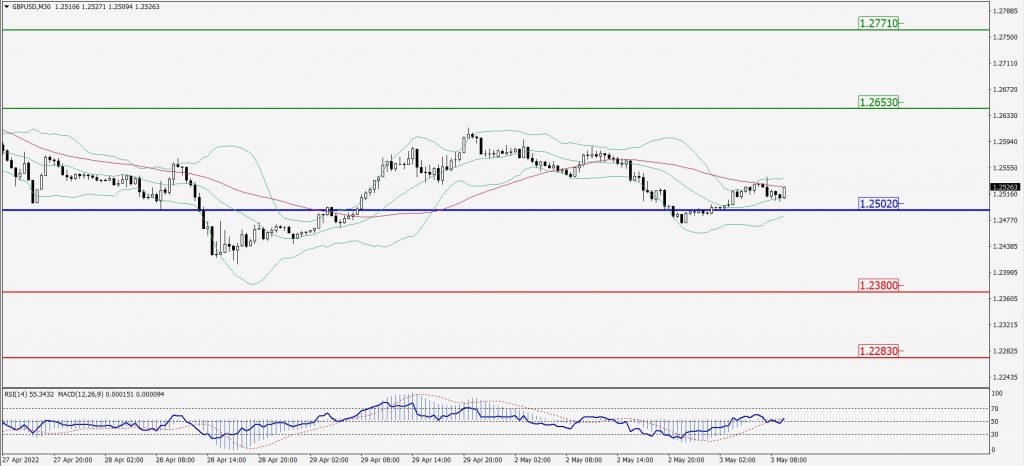
Green Lines Indicate Resistance Levels – Red Lines Indicate Support Levels
Light Blue is a Pivot Point – Black represents the price when the report was produced
USD/JPY Intraday: In a Consolidation Zone
Our pivot point is at 129.800
Preferable Price Action: Buy position above pivot with the target at 131.400 and 132.500 in extension.
Alternative Price Action: The downside breakout of the pivot would call for 128.100 and 127.100.
Comment: MACD in flat territory.
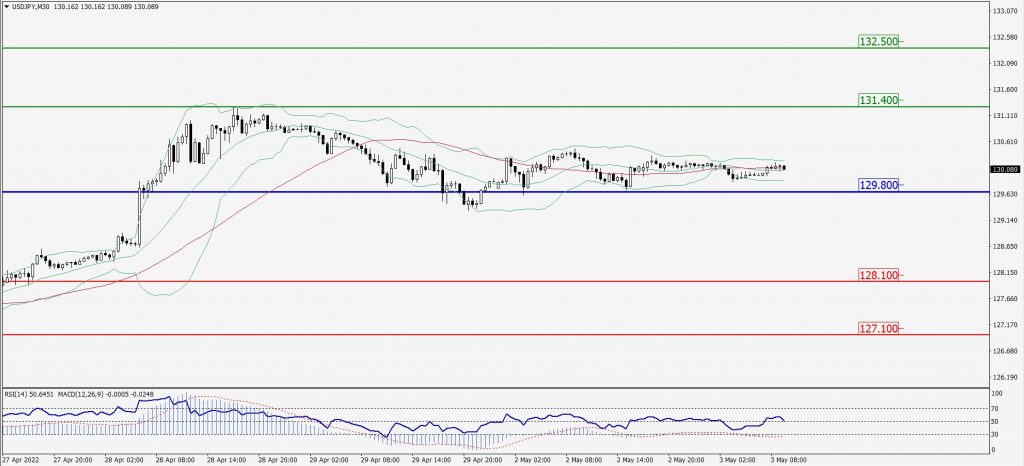
Green Lines Indicate Resistance Levels – Red Lines Indicate Support Levels
Light Blue is a Pivot Point – Black represents the price when the report was produced
AUD/USD Intraday: Trend on The Upside
Our pivot point is at 0.70940
Preferable Price Action: Buy Positions above pivot with targets at 0.71990 & 0.72850 in extension.
Alternative Price Action: Below pivot looks for a further downside with 0.69920 & 0.69180 as targets.
Comment: RSI above 50 levels and Pair above its 20MA & 55MA.
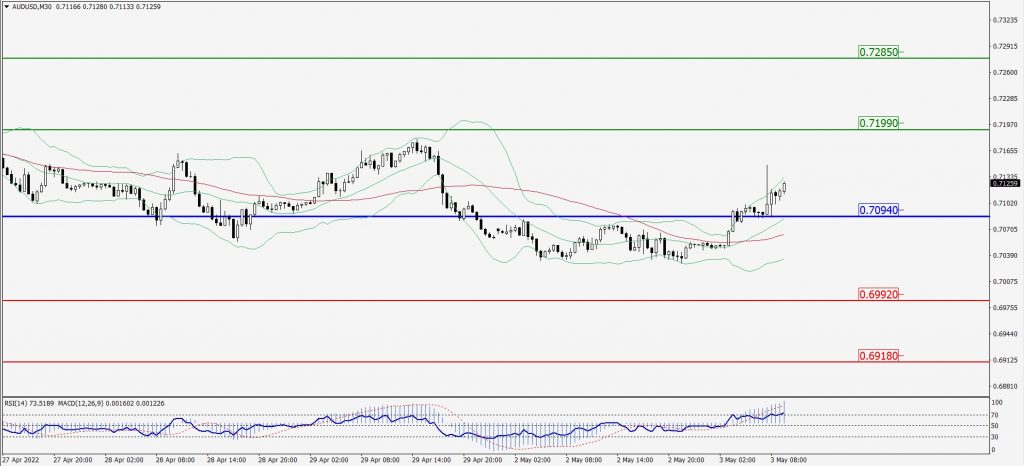
Green Lines Indicate Resistance Levels – Red Lines Indicate Support Levels
Light Blue is a Pivot Point – Black represents the price when the report was produced
CRUDEOIL Intraday: May Trend Reverse from 105.30
Our pivot point is at 105.30
Preferable Price Action: Below pivots sell oil with 101.00 & 97.50 as targets.
Alternative Price Action: Buy crude above pivot with targets at 109.10 and 111.60 in extension.
Comment: MACD is in the negative territory and Pair below 20MA.
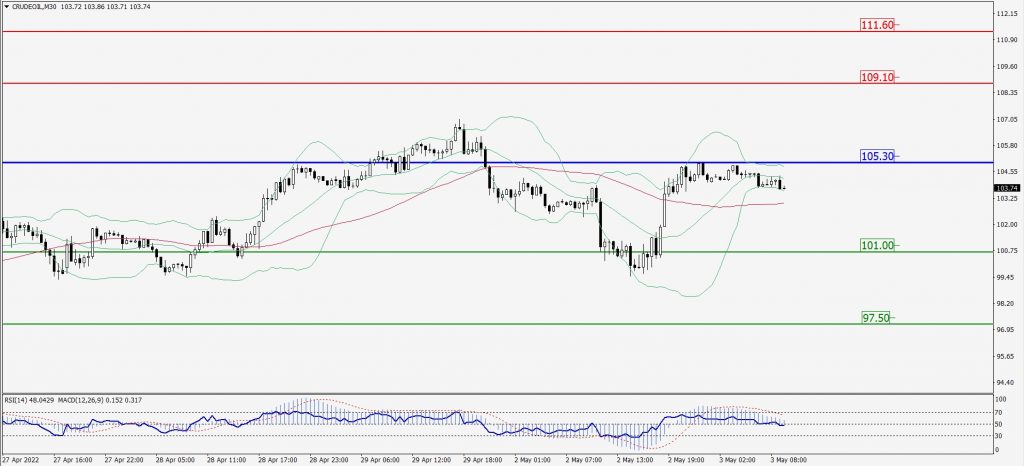
Green Lines Indicate Resistance Levels – Red Lines Indicate Support Levels
Light Blue is a Pivot Point – Black represents the price when the report was produced
XAU/USD Intraday: Major Trend on The Downside
Our pivot point is 1872.10
Preferable Price Action: Further downside to 1840.80 and 1822.70.
Alternative Price Action: If the price gives an upside breakout of a pivot, then the price extends to 1898.30 and 1918.10.
Comment: MACD is negative territory and Pair below its 20MA & 55MA.
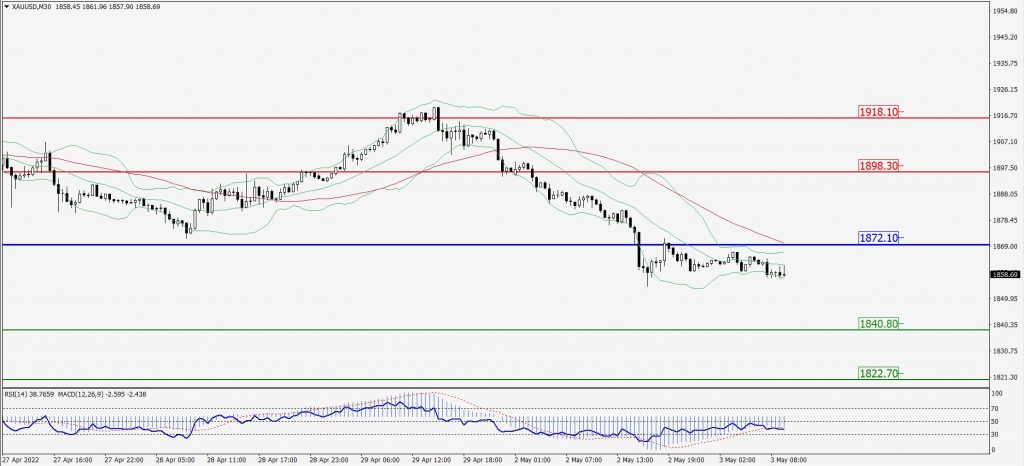
Green Lines Indicate Resistance Levels – Red Lines Indicate Support Levels
Light Blue is a Pivot Point – Black represents the price when the report was produced
Dow Jones Intraday: In a Consolidation Zone
Our pivot point is 32,931.00
Preferable Price Action: Take Buy positions above pivot with targets at 33,560.00 & 34,065.00.
Alternative Price Action: Below 32,931.00 looks for further downside to 32,377.00 & 31,955.00.
Comment: RSI above 50 levels and pair above 55MA.
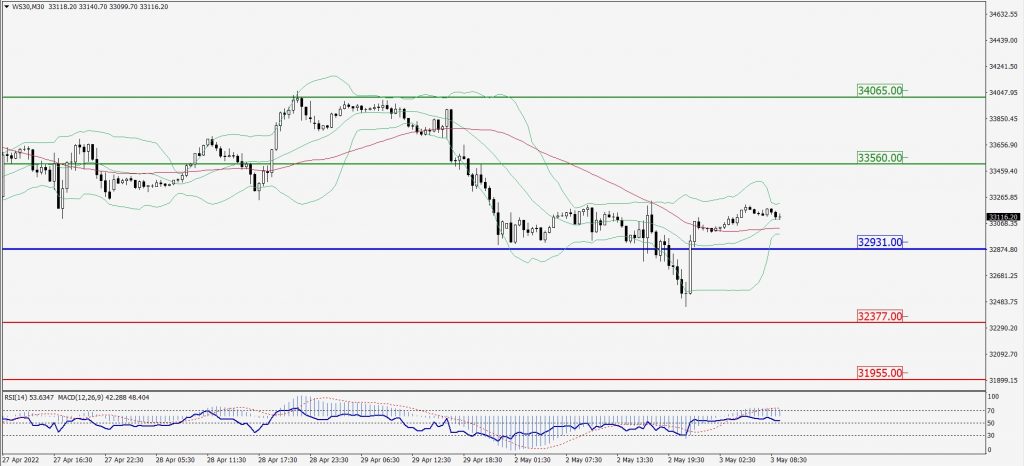
Green Lines Indicate Resistance Levels – Red Lines Indicate Support Levels
Light Blue is a Pivot Point – Black represents the price when the report was produced