Market Wrap: Stocks, Bonds, Commodities
Wall Street slid on Friday to its deepest daily losses since 2020, as Amazon slumped following a gloomy quarterly report, and as the biggest surge in monthly inflation since 2005 spooked investors already worried about rising interest rates.
The S&P 500 lose (3.63%) ended at 4,131.93 points, while the Nasdaq Composite down 4.17% to 12,871.53. The Dow Jones Industrial was fell 2.77% to 32,977.21.
MSCI’s index of Asia-Pacific stocks outside Japan is drop 0.32% to 684.34 levels. Australian index lower 1.18% to 7,347.00. Japanese Nikkei Index slipped 0.11% to 26,818.53.
European stocks were negative on Monday, with the Stoxx Europe 50 Index loss 1.65% to 3,740.18, Germany’s DAX drop 1.01% to 13,966.00, and France’s CAC down 1.53% to 6,433.71, and U.K.’s FTSE 100 increase 0.47% to 7,544.55.
Benchmark 10-year U.S. Treasury fell as demand for safe assets ascend again, today 10-year bond yields positive 2.9420.
Oil prices fell on Monday in holiday-sapped trade in Asia as concerns about slowing economic growth in China, the world’s top oil importer, outweighed fears of potential supply disruptions from a looming European Union ban on Russian crude.
Spot Brent crude oil fell 0.89% to $106.21 per barrel. US West Texas Intermediate crude is down 0.88% to $103.80 a barrel.
The yellow metal gold is decline 1.40% to 1,885.94 dollars per ounce.
Market Wrap: Forex
The dollar held near a 20-year high on Monday as the euro struggled around the $1.05 mark, as investors prepared for a busy week of central bank meetings including a likely Federal Reserve interest rate hike.
Today, the U.S. dollar index measures the Greenback against a trade-weighted basket of six major currencies, which is a rose of 0.37% to 103.340.
The Euro US Dollar (EUR/USD) is a widely traded pair that is down 0.08% today. This left the pair trading around $1.05320.
The Japanese yen was positive against the U.S. dollar on Monday as the stock up. Today USD/JPY is rose 0.22% to 130.120 level.
Another commodity-related currency negative against the U.S dollar, AUD/USD drop 0.13 to 0.70540, and NZD/USD lower 0.22% to 0.64420 level.
EUR/USD Intraday: Major Support Level at 1.05330
Our pivot point is at 1.05330
Preferable Price Action: Take Buy positions above pivot level with targets at 1.06110 & 1.06750 in extension.
Alternative Price Action: Below pivot looks for a further downside to 1.04630 & 1.04000.
Comment: RSI above 50 levels and Pair above its 20MA & 55MA.
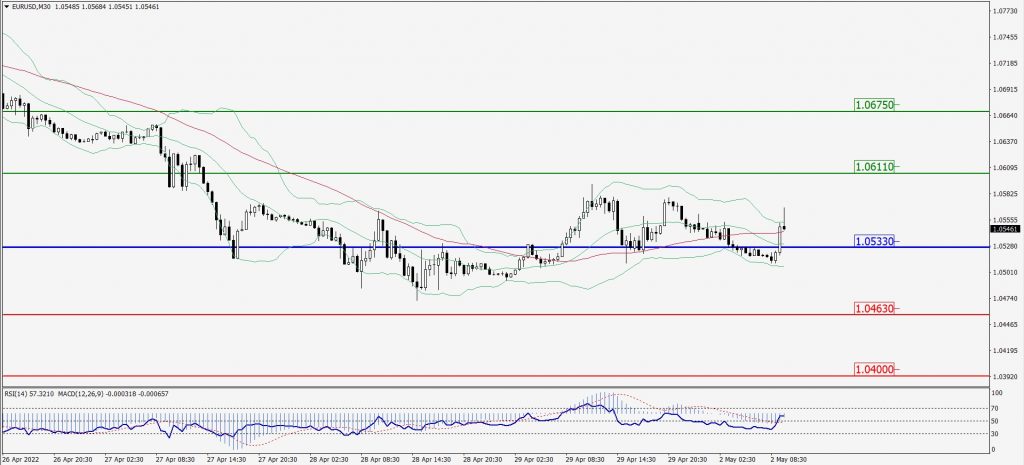
Green Lines Indicate Resistance Levels – Red Lines Indicate Support Levels
Light Blue is a Pivot Point – Black represents the price when the report was produced
GBP/USD Intraday: Trend on The Upside
Our pivot point is at 1.25330
Preferable Price Action: Buy positions above pivot with targets at 1.26790 & 1.27720 in extension.
Alternative Price Action: The price below pivot would call for further downside to 1.24090 & 1.23000.
Comment: RSI above 50 levels and Pair at 20MA.
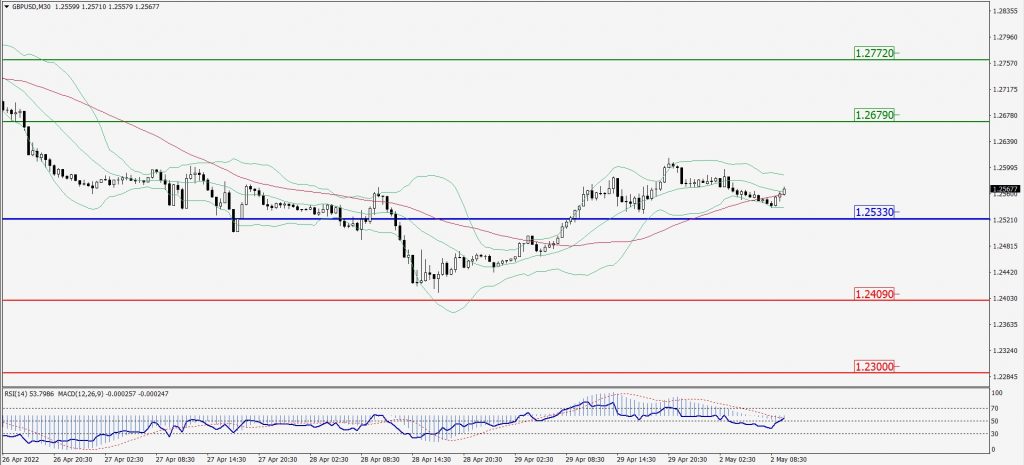
Green Lines Indicate Resistance Levels – Red Lines Indicate Support Levels
Light Blue is a Pivot Point – Black represents the price when the report was produced
USD/JPY Intraday: Trend on The Upside
Our pivot point is at 129.800
Preferable Price Action: Buy position above pivot with the target at 131.400 and 132.500 in extension.
Alternative Price Action: The downside breakout of the pivot would call for 128.100 and 127.100.
Comment: MACD in positive territory and Pair above 55MA.
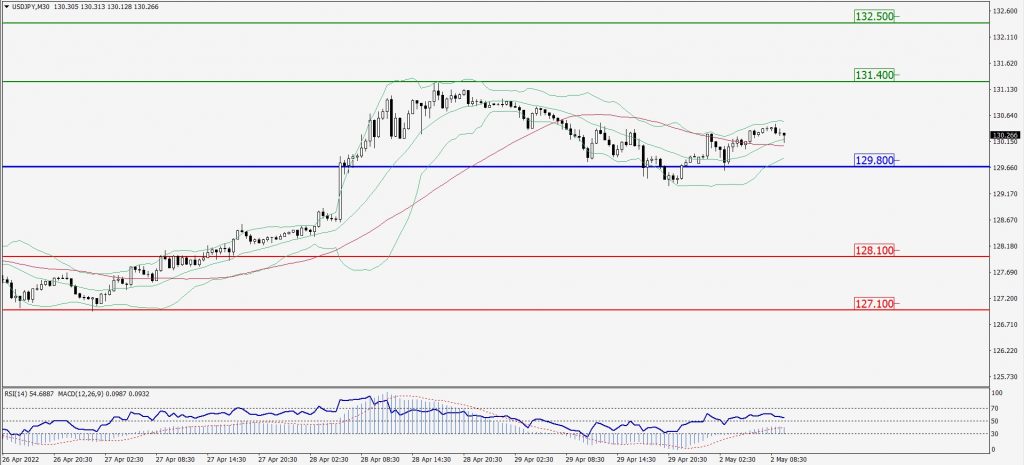
Green Lines Indicate Resistance Levels – Red Lines Indicate Support Levels
Light Blue is a Pivot Point – Black represents the price when the report was produced
AUD/USD Intraday: Trend on The Downside
Our pivot point is at 0.70940
Preferable Price Action: Sell Positions below pivot with targets at 0.69850 & 0.69120 in extension.
Alternative Price Action: Above pivot looks for a further upside with 0.71800 & 0.72510 as targets.
Comment: RSI below 50 levels and Pair below 55MA.
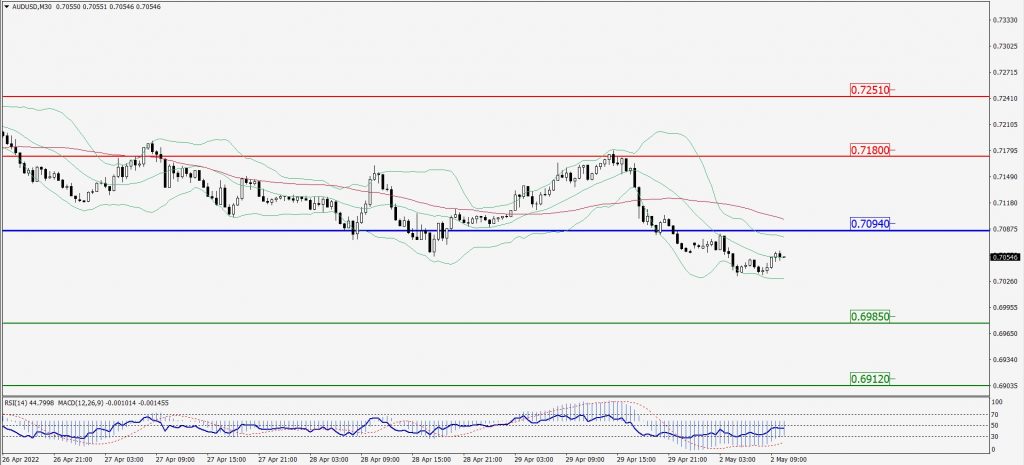
Green Lines Indicate Resistance Levels – Red Lines Indicate Support Levels
Light Blue is a Pivot Point – Black represents the price when the report was produced
CRUDEOIL Intraday: May Trend Reverse from 102.80
Our pivot point is at 102.80
Preferable Price Action: Above pivots buy oil with 106.50 & 108.90 as targets.
Alternative Price Action: Sell crude below pivot with targets at 98.80 and 96.60 in extension.
Comment: MACD is in the positive territory and Pair above 20MA.
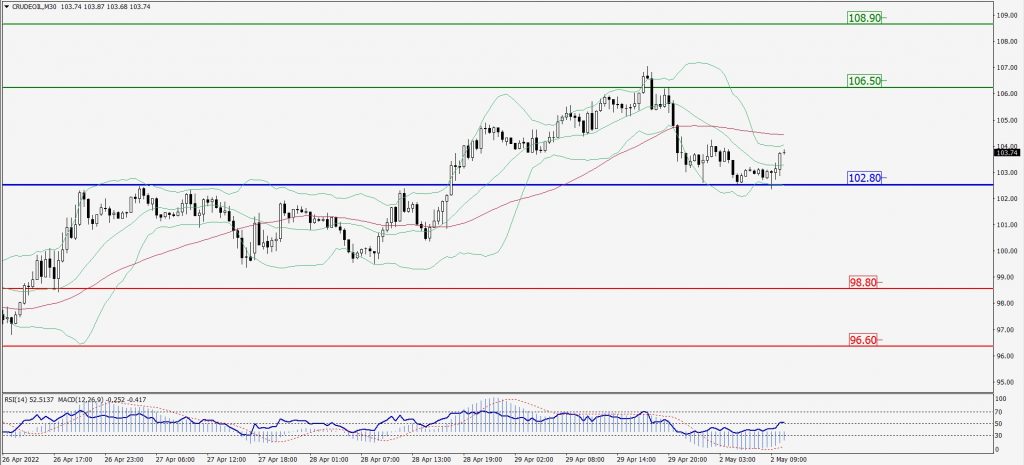
Green Lines Indicate Resistance Levels – Red Lines Indicate Support Levels
Light Blue is a Pivot Point – Black represents the price when the report was produced
XAU/USD Intraday: Major Trend on The Downside
Our pivot point is 1890.40
Preferable Price Action: Further downside to 1874.40 and 1858.70.
Alternative Price Action: If the price gives an upside breakout of a pivot, then the price extends to 1905.10 and 1916.70.
Comment: MACD is negative territory and Pair below its 20MA & 55MA.
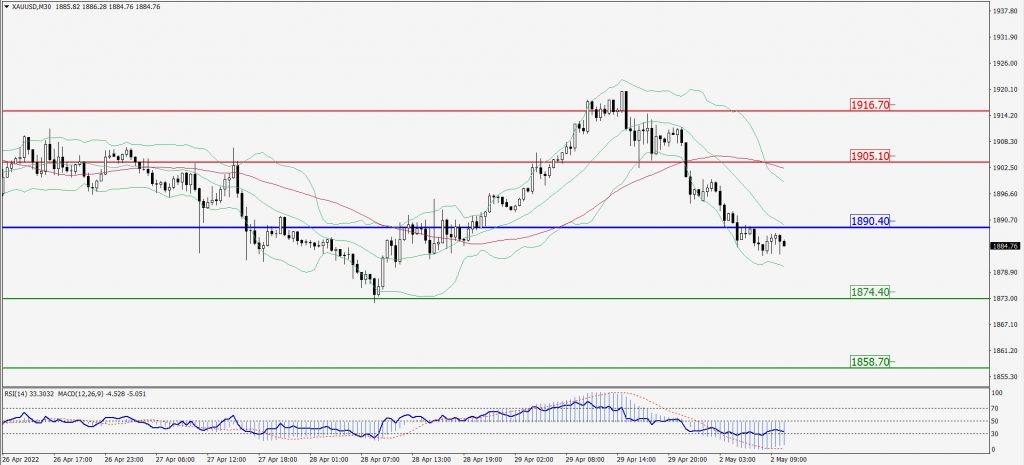
Green Lines Indicate Resistance Levels – Red Lines Indicate Support Levels
Light Blue is a Pivot Point – Black represents the price when the report was produced
Dow Jones Intraday: Trend on The Downside
Our pivot point is 33,312.00
Preferable Price Action: Take sell positions below pivot with targets at 32,613.00 & 32,121.00.
Alternative Price Action: Above 33,312.00 looks for further upside to 33,880.00 & 34,411.00.
Comment: RSI below 50 levels and pair below 55MA.
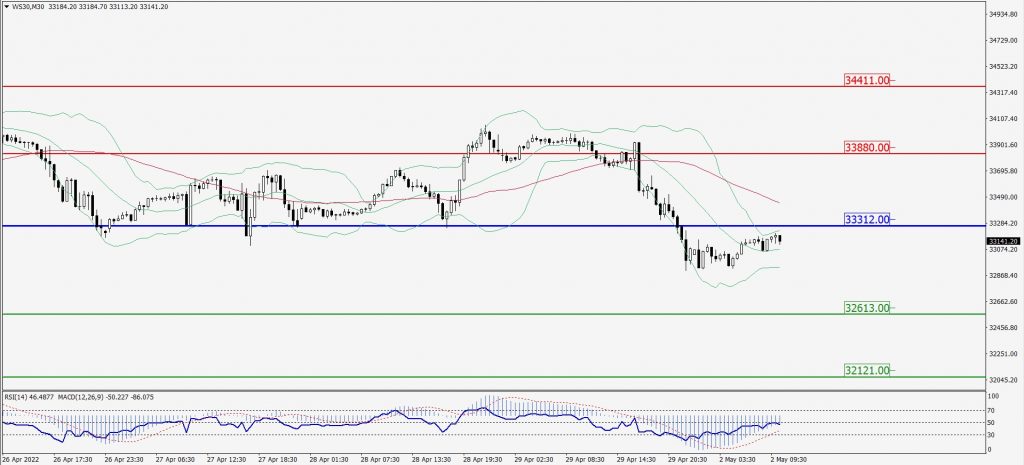
Green Lines Indicate Resistance Levels – Red Lines Indicate Support Levels
Light Blue is a Pivot Point – Black represents the price when the report was produced