Market Wrap: Stocks, Bonds, Commodities
U.S. stocks slumped to close out the first quarter on Thursday with its biggest quarterly decline in two years as concerns persisted about the continuing conflict in Ukraine and its inflationary effect on prices and the Federal Reserve’s response.
The S&P 500 lose (1.57%) ended at 4,530.41 points, while the Nasdaq Composite down 1.54% to 14,220.52. The Dow Jones Industrial was fell 1.56% to 34,678.35.
MSCI’s index of Asia-Pacific stocks outside Japan is drop 0.22% to 722.80 levels. Australian index lower 0.08% to 7,493.80. Japanese Nikkei Index slipped 0.56% to 27,665.98.
European stocks were Positive on Friday, with the Stoxx Europe 50 Index gain 0.31% to 3,914.55 Germany’s DAX ascend 0.27% to 14,454.42, and France’s CAC up 0.26% to 6,678.40, and U.K.’s FTSE 100 increase 0.30% to 7,537.26.
Benchmark 10-year U.S. Treasury fell as demand for safe assets ascend again, today 10-year bond yields a positive 2.415.
U.S. oil prices fell 7% to close just above $100 on Thursday as President Joe Biden announced the largest ever release from the U.S. Strategic Petroleum Reserve and called on oil companies to increase drilling to boost supply.
Spot Brent crude oil lose 1.08% to $103.57 per barrel. US West Texas Intermediate crude down 1.48% to $98.78 a barrel.
The yellow metal gold is decline 0.93% to 1,930.25 dollars per ounce.
Market Wrap: Forex
The dollar extended a rebound versus major peers on Friday, also resuming its rally against the yen, ahead of a key U.S. jobs report that could help the Federal Reserve decide whether to order an interest rate hike of up to 50 basis-points next month.
Today, the U.S. dollar index measures the Greenback against a trade-weighted basket of six major currencies, which is an increase of 0.20% to 98.555.
The Euro US Dollar (EUR/USD) is a widely traded pair that is negative today. This left the pair trading around $1.10540.
The Japanese yen was positive against the U.S. dollar on Friday as the stock up. Today USD/JPY is rose 0.69% to 122.500 level.
Another commodity-related currency mixed against the U.S dollar, AUD/USD up 0.17% to 0.74920, and NZD/USD lower 0.14% to 0.69250 level.
EUR/USD Intraday: Trend on The Downside
Our pivot point is at 1.10840
Preferable Price Action: Take short positions below pivot level with targets at 1.10190 & 1.09740 in extension.
Alternative Price Action: Above pivot looks for a further upside to 1.11480 & 1.11890.
Comment: RSI below 50 levels and Pair below its 20MA & 55MA.
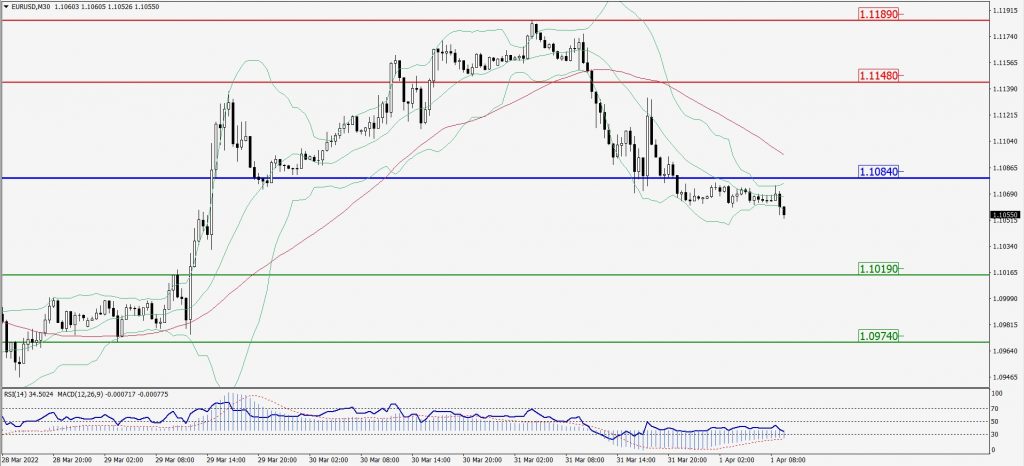
Green Lines Indicate Resistance Levels – Red Lines Indicates Support Levels
Light Blue is a Pivot Point – Black represents the price when the report was produced
GBP/USD Intraday: In a Consolidation Zone
Our pivot point is at 1.31350
Preferable Price Action: Sell positions below pivot with targets at 1.31020 & 1.30770 in extension.
Alternative Price Action: The price above pivot would call for further upside to 1.31610 & 1.31850.
Comment: RSI below 50 levels and Pair below its 20MA & 55MA.
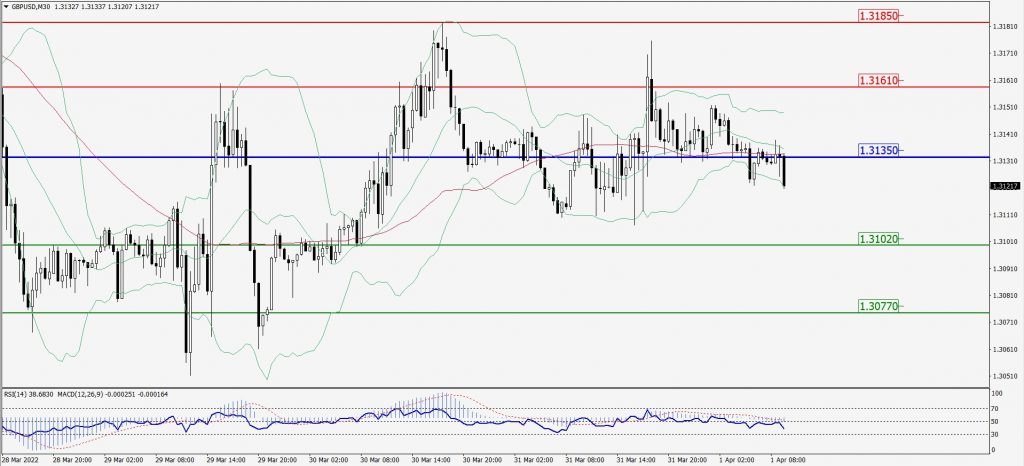
Green Lines Indicate Resistance Levels – Red Lines Indicates Support Levels
Light Blue is a Pivot Point – Black represents the price when the report was produced
USD/JPY Intraday: In a Consolidation Zone
Our pivot point is at 122.180
Preferable Price Action: Buy position above pivot with the target at 123.520 and 124.480 in extension.
Alternative Price Action: The downside breakout of the pivot would call for 120.980 and 120.090.
Comment: MACD in positive territory and Pair above its 20MA & 55MA.
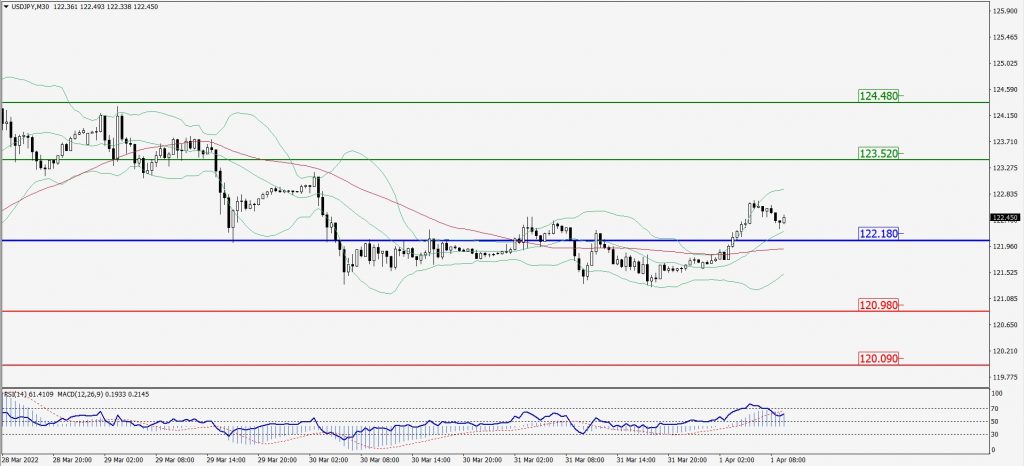
Green Lines Indicate Resistance Levels – Red Lines Indicates Support Levels
Light Blue is a Pivot Point – Black represents the price when the report was produced
AUD/USD Intraday: Trend on The Downside
Our pivot point is at 0.74920
Preferable Price Action: Sell Positions below pivot with targets at 0.74510 & 0.74210 in extension.
Alternative Price Action: Above pivot looks for a further upside with 0.75290 & 0.75600 as targets.
Comment: RSI below 50 levels and Pair below its 20MA & 55MA.
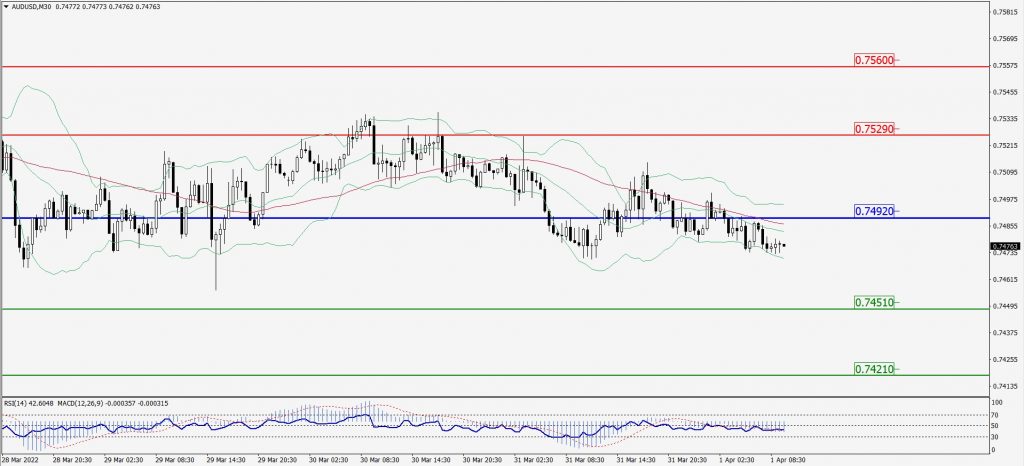
Green Lines Indicate Resistance Levels – Red Lines Indicates Support Levels
Light Blue is a Pivot Point – Black represents the price when the report was produced
CRUDEOIL Intraday: Trend on The Downside
Our pivot point is at 99.80
Preferable Price Action: Below pivots sell oil with 94.10 & 90.50 as targets.
Alternative Price Action: Buy crude above pivot with targets at 105.10 and 108.90 in extension.
Comment: MACD is in the negative territory and Pair below its 20MA & 55MA.
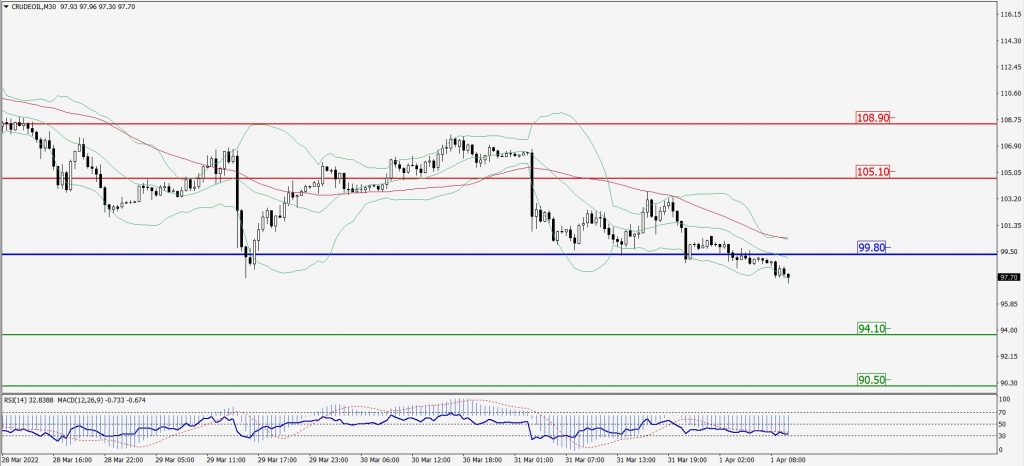
Green Lines Indicate Resistance Levels – Red Lines Indicates Support Levels
Light Blue is a Pivot Point – Black represents the price when the report was produced
XAU/USD Intraday: In a Consolidation Zone
Our pivot point is 1940.40
Preferable Price Action: Further downside to 1918.70 and 1899.00.
Alternative Price Action: If the price gives an upside breakout of a pivot, then the price extends to 1960.20 and 1978.60.
Comment: MACD is a negative territory and Pair below its 20MA & 55MA.
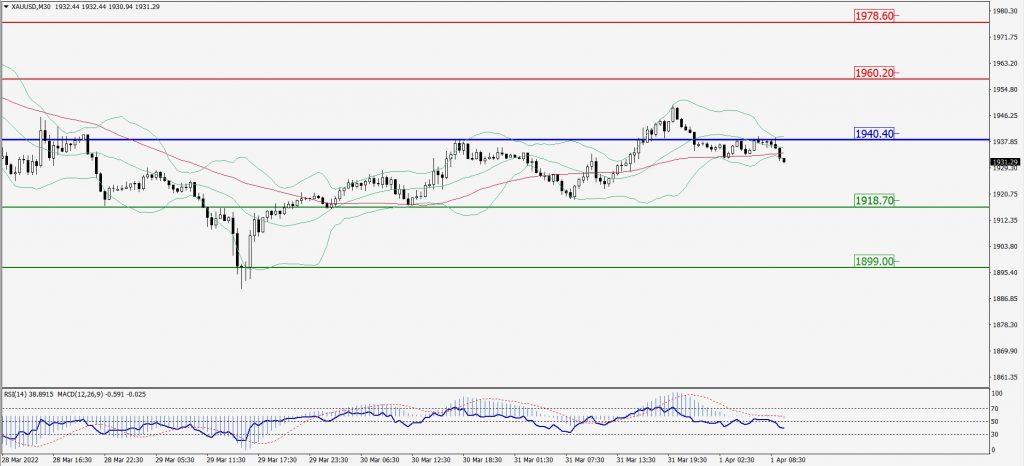
Green Lines Indicate Resistance Levels – Red Lines Indicates Support Levels
Light Blue is a Pivot Point – Black represents the price when the report was produced
Dow Jones Intraday: Trend on The Downside
Our pivot point is 34,994.00
Preferable Price Action: Take short positions below pivot with targets at 34,494.00 & 34,185.00.
Alternative Price Action: Above 34,994.00 looks for further upside to 35,409.00 & 35,731.00.
Comment: RSI below 50 levels and Pair below 55MA.
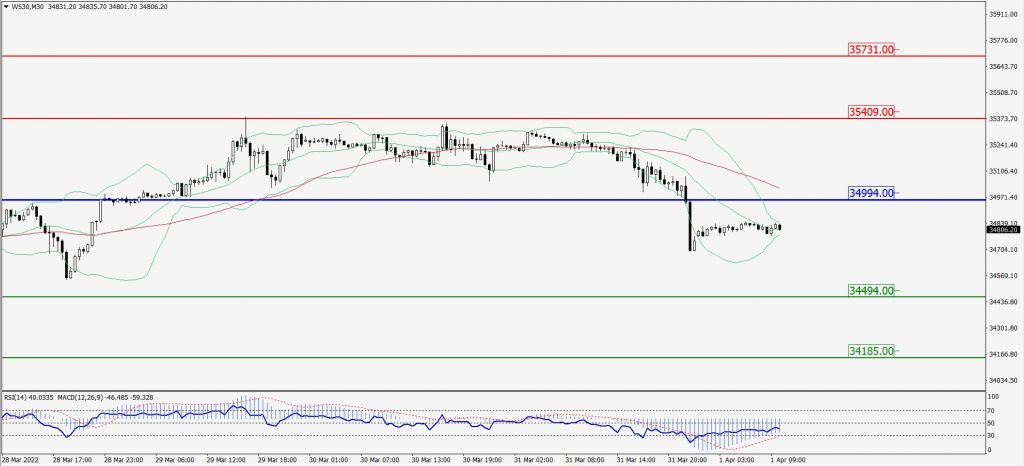
Green Lines Indicate Resistance Levels – Red Lines Indicates Support Levels
Light Blue is a Pivot Point – Black represents the price when the report was produced