Market Wrap: Stocks, Bonds, Commodities
The S&P 500 rose modestly to kick off the second quarter on Friday, as the monthly jobs report indicated a strong labor market and is likely to keep the Federal Reserve on track to maintain its hawkish policy stance.
The S&P 500 gain(0.34%) ended at 4,545.86 points, while the Nasdaq Composite up 0.29% to 14,261.50. The Dow Jones Industrial was rose 0.40% to 34,818.27.
MSCI’s index of Asia-Pacific stocks outside Japan is ascend 1.06% to 733.65 levels. Australian index higher 0.27% to 7,513.70. Japanese Nikkei Index surge 0.25% to 27,736.47.
European stocks were Positive on Monday, with the Stoxx Europe 50 Index lose 0.45% to 3,900.95 Germany’s DAX drop 0.53% to 14,367.63, and France’s CAC down 0.47% to 6,652.71, and U.K.’s FTSE 100 increase 0.01% to 7,539.55.
Benchmark 10-year U.S. Treasury fell as demand for safe assets ascend again, today 10-year bond yields a positive 2.408.
Oil settled lower on Friday as members of the International Energy Agency (IEA) agreed to join in the largest-ever U.S. oil reserves release. Both Brent and U.S. crude benchmarks settled down around 13 percent in their biggest weekly falls in two years after US President Joe Biden announced the release on Thursday.
Spot Brent crude oil gain 0.77% to $105.22 per barrel. US West Texas Intermediate crude up 0.90% to $100.16 a barrel.
The yellow metal gold is advance 0.40% to 1,931.40 dollars per ounce.
Market Wrap: Forex
The dollar made a firm start to the week as Treasury yields rose with expectations of rapid-fire U.S. interest rate hikes, while talk of Europe banning Russian gas kept a lid on the euro.
Today, the U.S. dollar index measures the Greenback against a trade-weighted basket of six major currencies, which is an increase of 0.03% to 98.660.
The Euro US Dollar (EUR/USD) is a widely traded pair that is negative today. This left the pair trading around $1.10260.
The Japanese yen was positive against the U.S. dollar on Monday as the stock up. Today USD/JPY is rose 0.04% to 122.550 level.
Another commodity-related currency positive against the U.S dollar, AUD/USD up 0.25% to 0.75190, and NZD/USD higher 0.10% to 0.69350 level.
EUR/USD Intraday: Trend on The Downside
Our pivot point is at 1.10680
Preferable Price Action: Take short positions below pivot level with targets at 1.10170 & 1.09750 in extension.
Alternative Price Action: Above pivot looks for a further upside to 1.11110 & 1.11500.
Comment: RSI below 50 levels and Pair below its 20MA & 55MA.
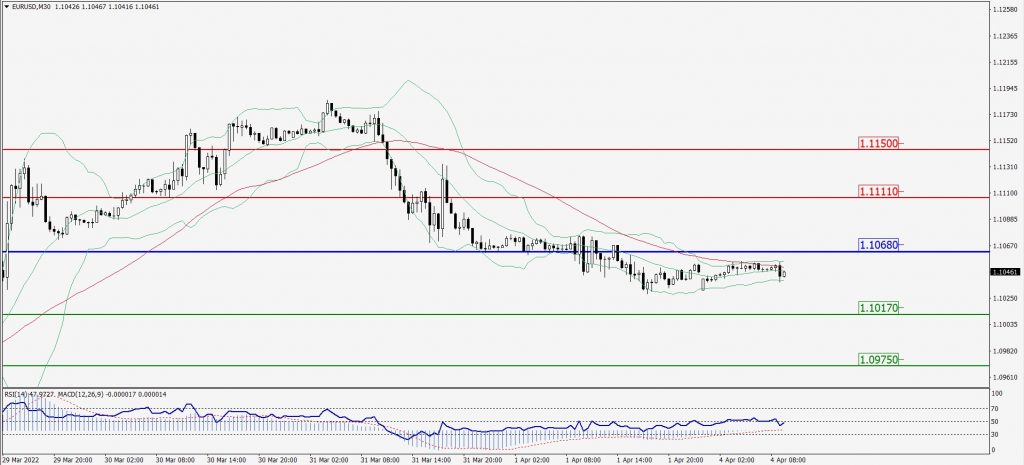
Green Lines Indicate Resistance Levels – Red Lines Indicates Support Levels
Light Blue is a Pivot Point – Black represents the price when the report was produced
GBP/USD Intraday: In a Consolidation Zone
Our pivot point is at 1.31260
Preferable Price Action: Buy positions above pivot with targets at 1.31540 & 1.31780 in extension.
Alternative Price Action: The price below pivot would call for further downside to 1.31020 & 1.30760.
Comment: RSI above 50 levels and Pair above its 20MA & 55MA.
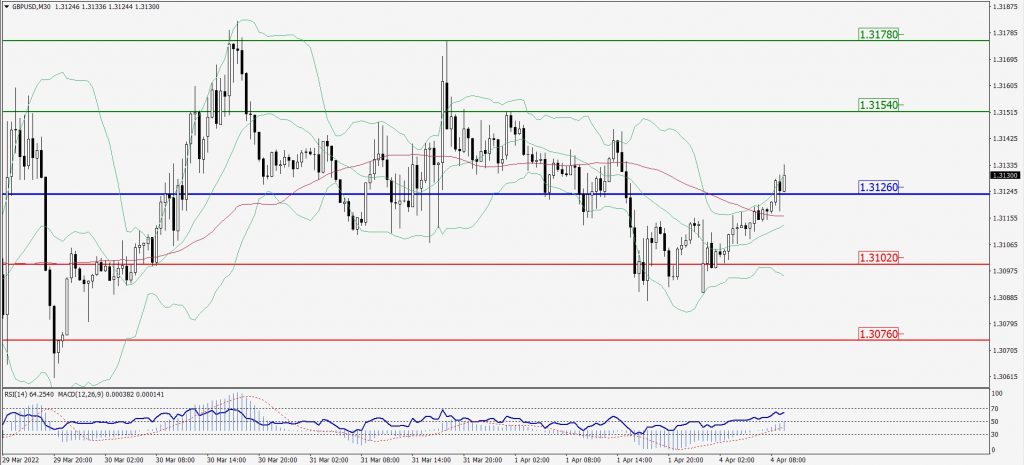
Green Lines Indicate Resistance Levels – Red Lines Indicates Support Levels
Light Blue is a Pivot Point – Black represents the price when the report was produced
USD/JPY Intraday: Trend on The Upside
Our pivot point is at 122.380
Preferable Price Action: Buy position above pivot with the target at 123.560 and 124.450 in extension.
Alternative Price Action: The downside breakout of the pivot would call for 121.390 and 120.400.
Comment: MACD in positive territory and Pair above its 20MA & 55MA.
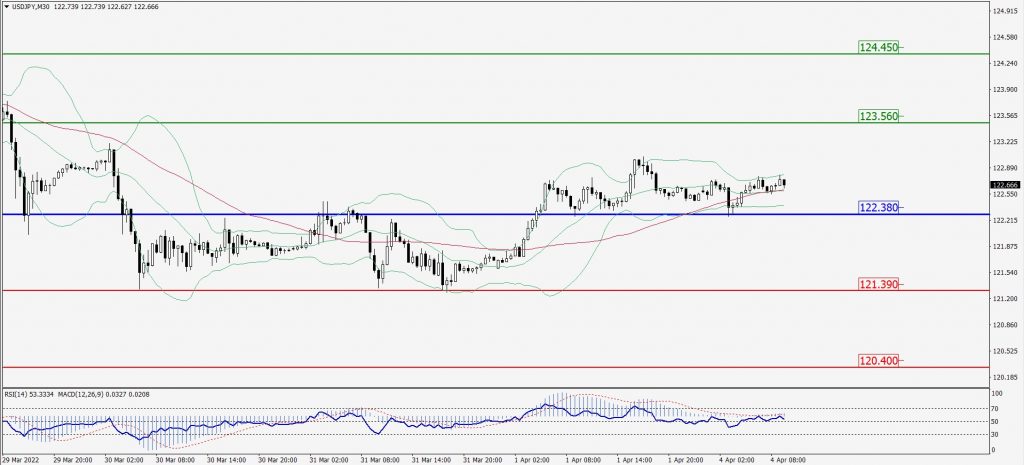
Green Lines Indicate Resistance Levels – Red Lines Indicates Support Levels
Light Blue is a Pivot Point – Black represents the price when the report was produced
AUD/USD Intraday: Trend on The Upside
Our pivot point is at 0.75020
Preferable Price Action: Buy Positions above pivot with targets at 0.75390 & 0.75720 in extension.
Alternative Price Action: Below pivot looks for a further downside with 0.74690 & 0.74360 as targets.
Comment: RSI above 50 levels and Pair above its 20MA & 55MA.
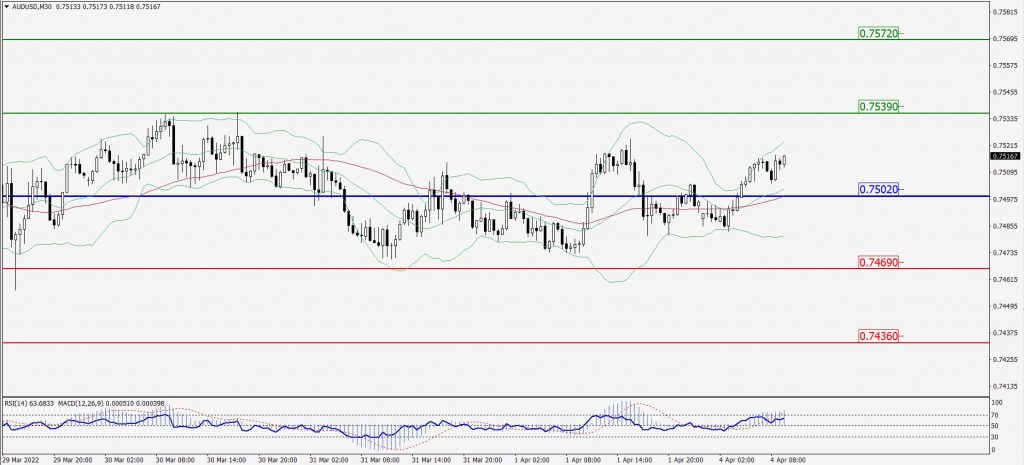
Green Lines Indicate Resistance Levels – Red Lines Indicates Support Levels
Light Blue is a Pivot Point – Black represents the price when the report was produced
CRUDEOIL Intraday: Major Support Level at 98.28
Our pivot point is at 98.28
Preferable Price Action: Above pivots Buy oil with 102.46 & 106.00 as targets.
Alternative Price Action: Sell crude below pivot with targets at 94.86 and 90.85 in extension.
Comment: MACD is in the positive territory and Pair above its 20MA & 55MA.
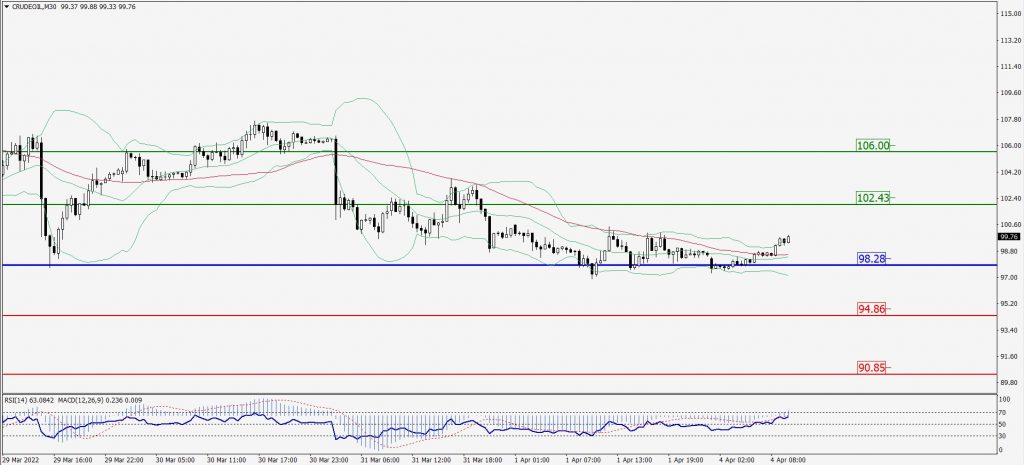
Green Lines Indicate Resistance Levels – Red Lines Indicates Support Levels
Light Blue is a Pivot Point – Black represents the price when the report was produced
XAU/USD Intraday: In a Consolidation Zone
Our pivot point is 1922.60
Preferable Price Action: Further upside to 1950.70 and 1969.30.
Alternative Price Action: If the price gives a downside breakout of a pivot, then the price extends to 1900.00 and 1979.40.
Comment: MACD is a positive territory and Pair above its 20MA & 55MA.
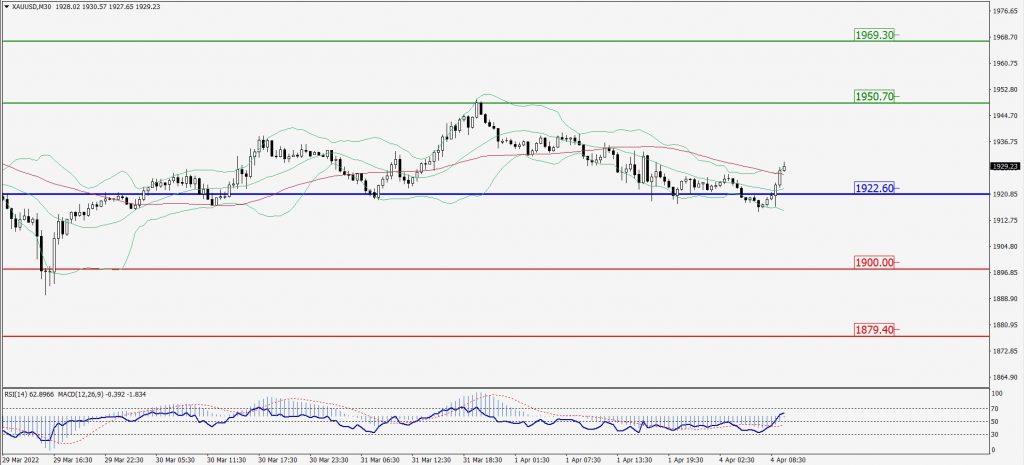
Green Lines Indicate Resistance Levels – Red Lines Indicates Support Levels
Light Blue is a Pivot Point – Black represents the price when the report was produced
Dow Jones Intraday: Trend on The Downside
Our pivot point is 34,988.00
Preferable Price Action: Take short positions below pivot with targets at 34,486.00 & 34,187.00.
Alternative Price Action: Below 34,988.00 looks for further upside to 35,403.00 & 35,724.00.
Comment: RSI below 50 levels.
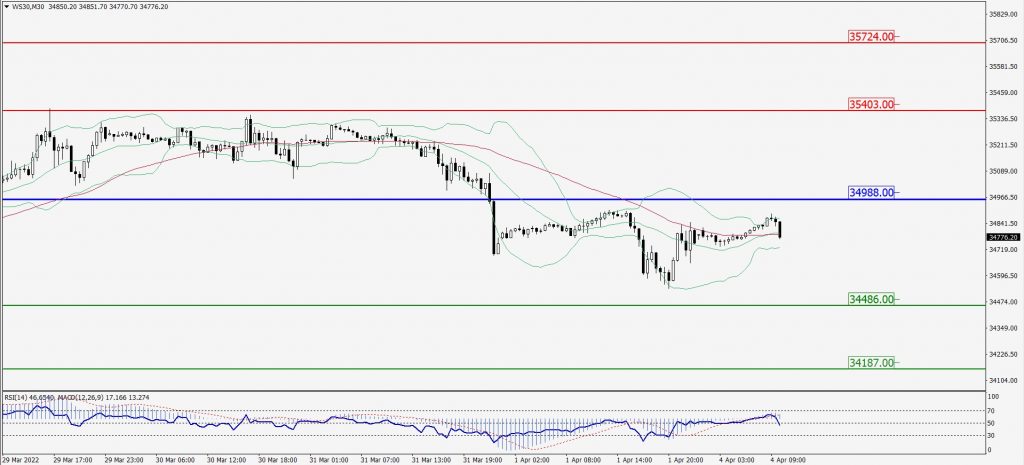
Green Lines Indicate Resistance Levels – Red Lines Indicates Support Levels
Light Blue is a Pivot Point – Black represents the price when the report was produced