Market Wrap: Stocks, Bonds, Commodities
U.S. stocks fell on Wednesday, with the Dow and S&P 500 snapping four-session winning streaks, on waning signs of progress for peace talks between Ukraine and Russia against a backdrop of a hawkish Federal Reserve curbing economic growth.
The S&P 500 lose (0.63%) ended at 4,602.45 points, while the Nasdaq Composite down 1.21% to 14,442.28. The Dow Jones Industrial was fell 0.19% to 35,228.81.
MSCI’s index of Asia-Pacific stocks outside Japan is drop 0.36% to 727.90 levels. Australian index lower 0.20% to 7,499.60. Japanese Nikkei Index slipped 0.73% to 27,821.43.
European stocks were Positive on Thursday, with the Stoxx Europe 50 Index gain 0.07% to 3,962.05 Germany’s DAX ascend 0.22% to 14,635.67, and France’s CAC up 0.12% to 6,750.24, and U.K.’s FTSE 100 increase 0.04% to 7,581.25.
Benchmark 10-year U.S. Treasury fell as demand for safe assets ascend again, today 10-year bond yields a negative 2.318.
Oil futures dived more than $5 a barrel on Thursday morning on news that the Biden administration is weighing releasing some 1 million barrels of oil per day from strategic reserves for several months in a bid to calm soaring crude prices.
Spot Brent crude oil lose 3.50% to $107.53 per barrel. US West Texas Intermediate crude down 4.47% to $103.00 a barrel.
The yellow metal gold is decline 0.28% to 1,928.00 dollars per ounce.
Market Wrap: Forex
The dollar dropped to a nearly two-week low on Wednesday as optimism over peace talks between Russia and Ukraine faded and investors’ attention shifted to economic data and interest rate expectations.
Today, the U.S. dollar index measures the Greenback against a trade-weighted basket of six major currencies, which is a decrease of 0.03% to 97.885.
The Euro US Dollar (EUR/USD) is a widely traded pair that is positive today. This left the pair trading around $1.11590.
The Japanese yen was positive against the U.S. dollar on Thursday as the stock up. Today USD/JPY is fell 0.15% to 121.610 level.
Another commodity-related currency negative against the U.S dollar, AUD/USD down 0.48% to 0.74730, and NZD/USD lower 0.41% to 0.6946 level.
EUR/USD Intraday: Trend on The Upside
Our pivot point is at 1.11440
Preferable Price Action: Take Long positions above pivot level with targets at 1.12220 & 1.12740 in extension.
Alternative Price Action: Below pivot looks for a further downside to 1.10650 & 1.10110.
Comment: RSI below 50 levels and Pair above 55MA.
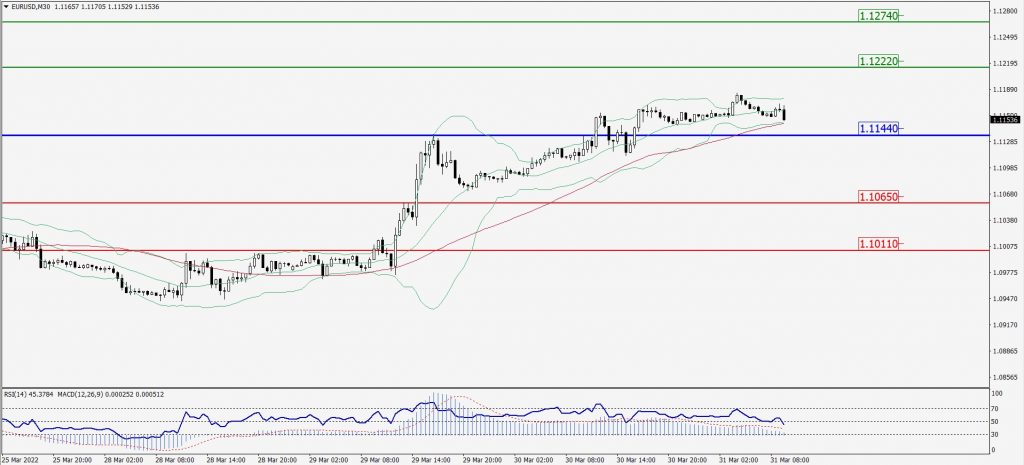
Green Lines Indicate Resistance Levels – Red Lines Indicates Support Levels
Light Blue is a Pivot Point – Black represents the price when the report was produced
GBP/USD Intraday: In a Consolidation Zone
Our pivot point is at 1.31180
Preferable Price Action: Buy positions above pivot with targets at 1.31600 & 1.31930 in extension.
Alternative Price Action: The price below pivot would call for further downside to 1.30760 & 1.30430.
Comment: RSI at 50 levels and Pair above 20MA.
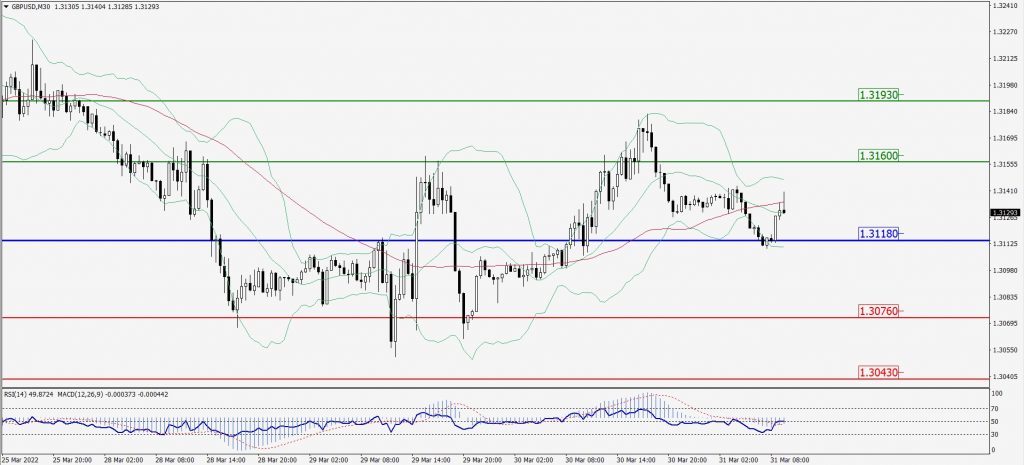
Green Lines Indicate Resistance Levels – Red Lines Indicates Support Levels
Light Blue is a Pivot Point – Black represents the price when the report was produced
USD/JPY Intraday: Trend on The Downside
Our pivot point is at 122.340
Preferable Price Action: Sell position below pivot with the target at 121.140 and 120.220 in extension.
Alternative Price Action: The upside breakout of the pivot would call for 123.500 and 124.510.
Comment: MACD in negative territory and Pair below its 20MA & 55MA.
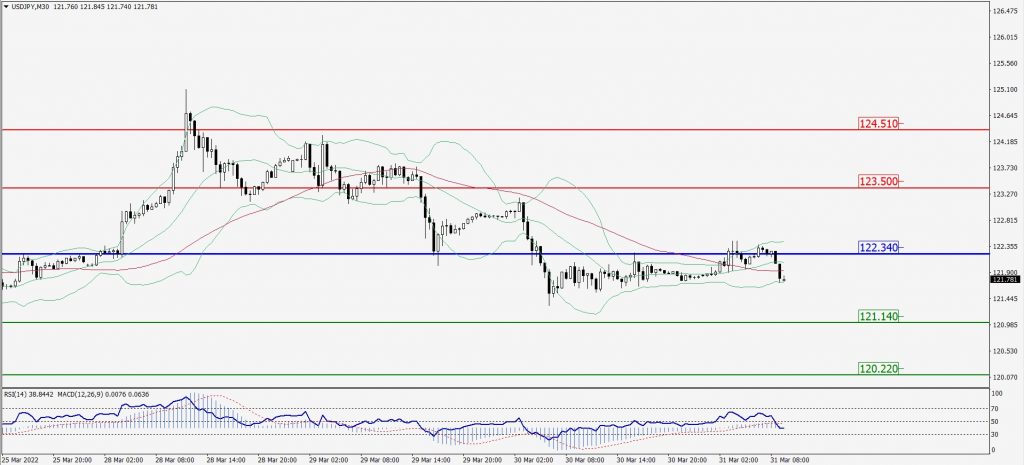
Green Lines Indicate Resistance Levels – Red Lines Indicates Support Levels
Light Blue is a Pivot Point – Black represents the price when the report was produced
AUD/USD Intraday: In a Consolidation Zone
Our pivot point is at 0.75010
Preferable Price Action: Sell Positions below pivot with targets at 0.74660 & 0.74340 in extension.
Alternative Price Action: Above pivot looks for a further upside with 0.75340 & 0.75640 as targets.
Comment: RSI below 50 levels and Pair below its 20MA & 55MA.
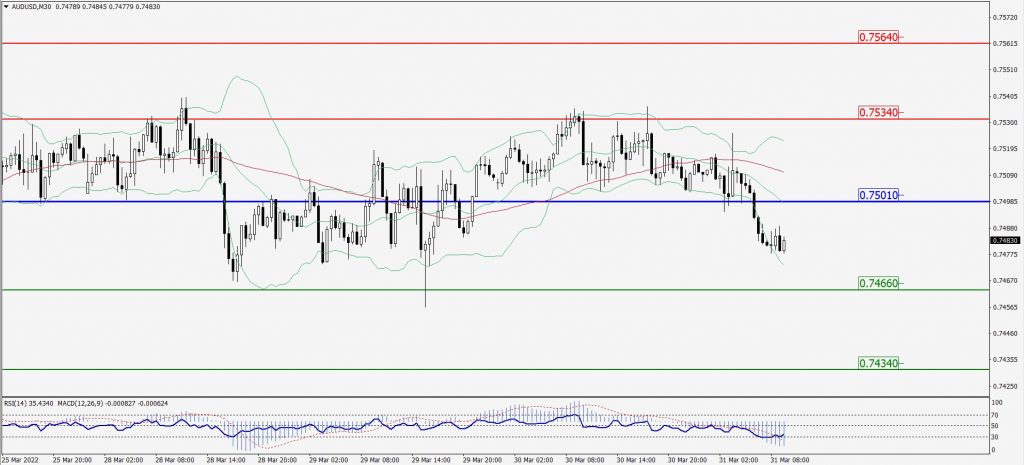
Green Lines Indicate Resistance Levels – Red Lines Indicates Support Levels
Light Blue is a Pivot Point – Black represents the price when the report was produced
CRUDEOIL Intraday: Trend on The Downside
Our pivot point is at 103.40
Preferable Price Action: Below pivots sell oil with 99.30 & 96.40 as targets.
Alternative Price Action: Buy crude above pivot with targets at 107.00 and 110.00 in extension.
Comment: MACD is in the negative territory and Pair below its 20MA & 55MA.
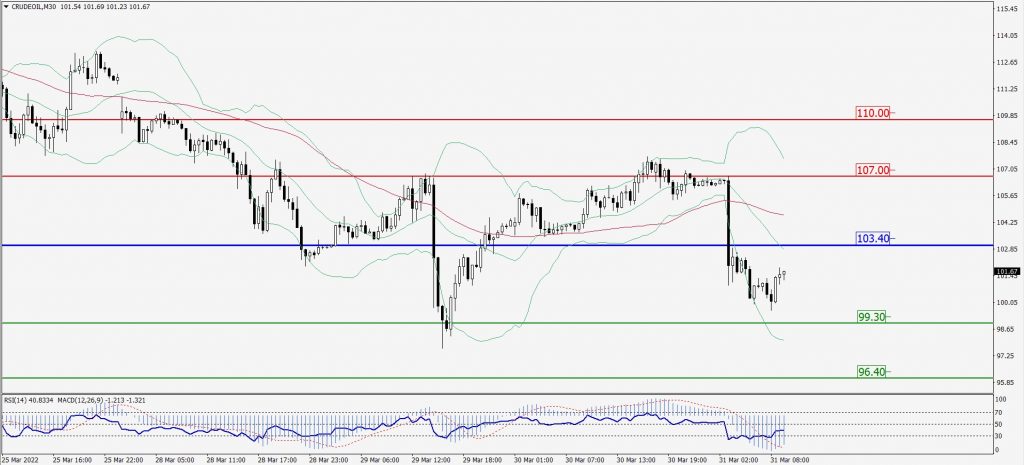
Green Lines Indicate Resistance Levels – Red Lines Indicates Support Levels
Light Blue is a Pivot Point – Black represents the price when the report was produced
XAU/USD Intraday: May Trend Reverse from 1921.10
Our pivot point is 1921.10
Preferable Price Action: Further upside to 1940.40 and 1953.60.
Alternative Price Action: If the price gives a downside breakout of a pivot, then the price extends to 1901.00 and 1888.30.
Comment: MACD is a flat territory.
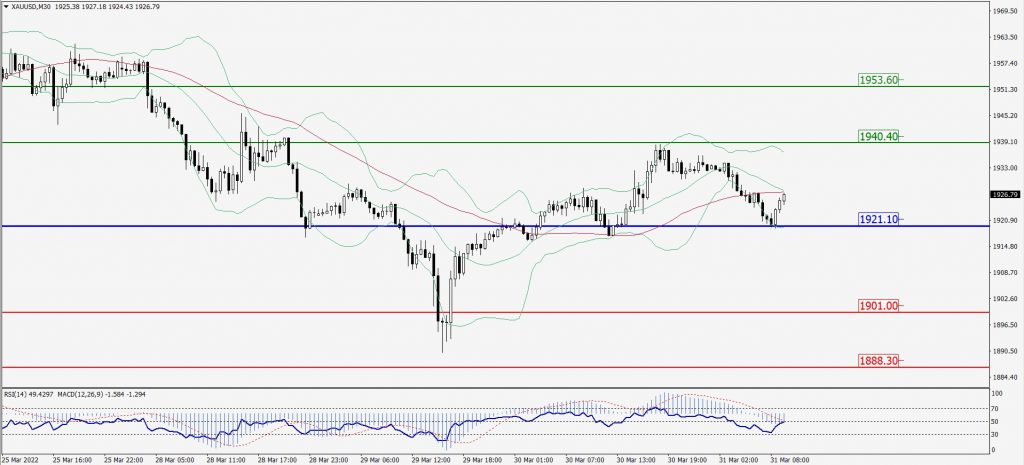
Green Lines Indicate Resistance Levels – Red Lines Indicates Support Levels
Light Blue is a Pivot Point – Black represents the price when the report was produced
Dow Jones Intraday: In a Consolidation Zone
Our pivot point is 35,183.00
Preferable Price Action: Take long positions above pivot with targets at 35,478.00 & 35,723.00.
Alternative Price Action: Below 35,183.00 looks for further downside to 34,892.00 & 34,631.00.
Comment: RSI at 50 levels and Pair above 55MA.
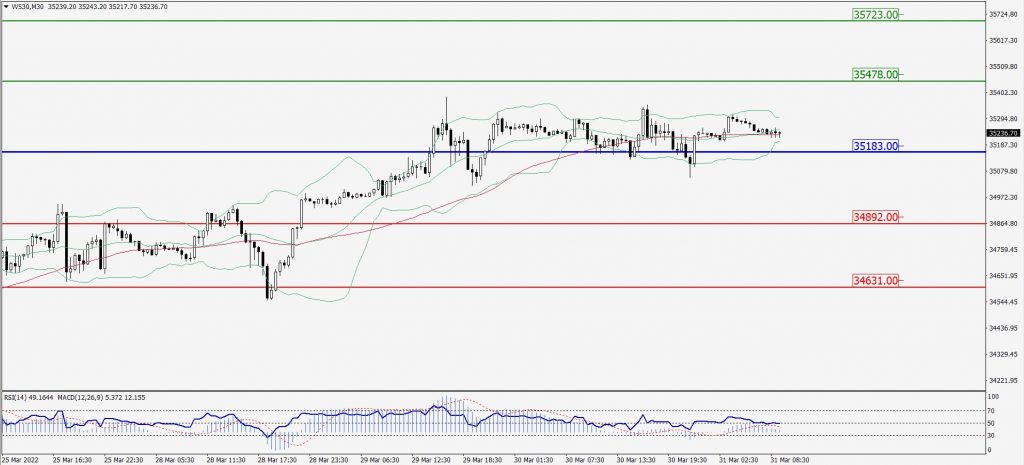
Green Lines Indicate Resistance Levels – Red Lines Indicates Support Levels
Light Blue is a Pivot Point – Black represents the price when the report was produced