Market Wrap: Stocks, Bonds, Commodities
The three main Wall Street stock indexes rallied on Tuesday, a day before an expected interest rate hike by the US Federal Reserve, while oil prices dropped 7% on hopes of an end to the conflict in Ukraine.
The S&P 500 gain (2.14%) ended at 4,262.45 points, while the Nasdaq Composite accepted 2.92% to 12,948.62. The Dow Jones Industrial was rose 1.82% to 33,544.34.
MSCI’s index of Asia-Pacific stocks outside Japan is gained 4.74% to 681.87 levels. Australian index higher 1.10% to 7,175.20. Japanese Nikkei Index surged 1.64% to 25,762.01.
European stocks were Positive on Wednesday, with the Stoxx Europe 50 Index up 2.57% to 3,834.15 Germany’s DAX collected 2.28% to 14,235.26, and France’s CAC rose 2.30% to 6,501.36, and U.K.’s FTSE 100 climbed 1.29% to 7,268.10.
Benchmark 10-year U.S. Treasury rose as demand for safe assets gain again, today 10-year bond yields a positive 2.171.
Oil prices tumbled more than 6% on Tuesday to their lowest in almost three weeks, as Russia suggested it would allow a revival of the Iran nuclear deal to go forward and as traders worried growing pandemic lockdowns in China could dent demand.
Spot Brent crude oil gained 2.67% to $102.58 per barrel. US West Texas Intermediate crude up 1.99% to $98.36 a barrel.
The yellow metal gold is descend 0.40% to 1,922.00 dollars per ounce.
Market Wrap: Forex
The Australian dollar jumped on Wednesday after comments from a senior Chinese official boosted hopes for more stimulus, while the U.S. dollar traded near a five-year high against the yen with markets expecting the Federal Reserve to lift interest rates for the first time in three years.
Today, the U.S. dollar index measures the Redback against a trade-weighted basket of six major currencies, which is fell 0.36% to 98.703.
The Euro US Dollar (EUR/USD) is a widely traded pair that is positive today. This left the pair trading around $1.0987.
The Japanese yen was positive against the U.S. dollar on Wednesday as the stock up. Today USD/JPY is rose 0.03% to 118.310 level.
Another commodity-related currency positive against the U.S dollar, AUD/USD up 0.50% to 0.72320, and NZD/USD higher 0.30% to 0.67890 level.
EUR/USD Intraday: In a Consolidation Zone
Our pivot point is at 1.09700
Preferable Price Action: Take Long positions above pivot level with targets at 1.10140 & 1.10590 in extension.
Alternative Price Action: Below pivot looks for a further downside to 1.09250 & 1.08790.
Comment: RSI above 50 levels.
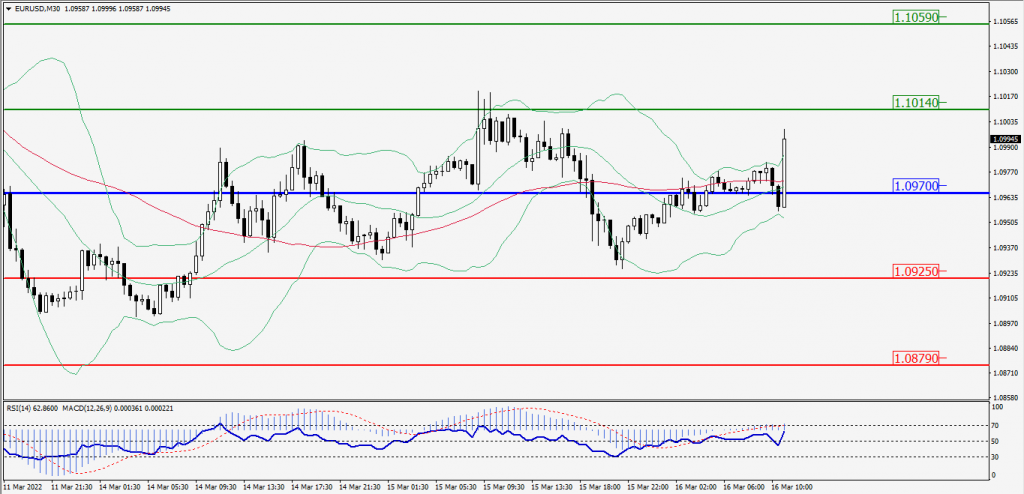
Green Lines Indicate Resistance Levels – Red Lines Indicates Support Levels
Light Blue is a Pivot Point – Black represents the price when the report was produced
GBP/USD Intraday: In a Consolidation Zone
Our pivot point is at 1.30570
Preferable Price Action: Buy positions Above pivot with targets at 1.30850 & 1.31130 in extension.
Alternative Price Action: The price Below pivot would call for further Downside to 1.30290 & 1.30010.
Comment: RSI above 50 levels and Pair above its 20MA & 55MA.
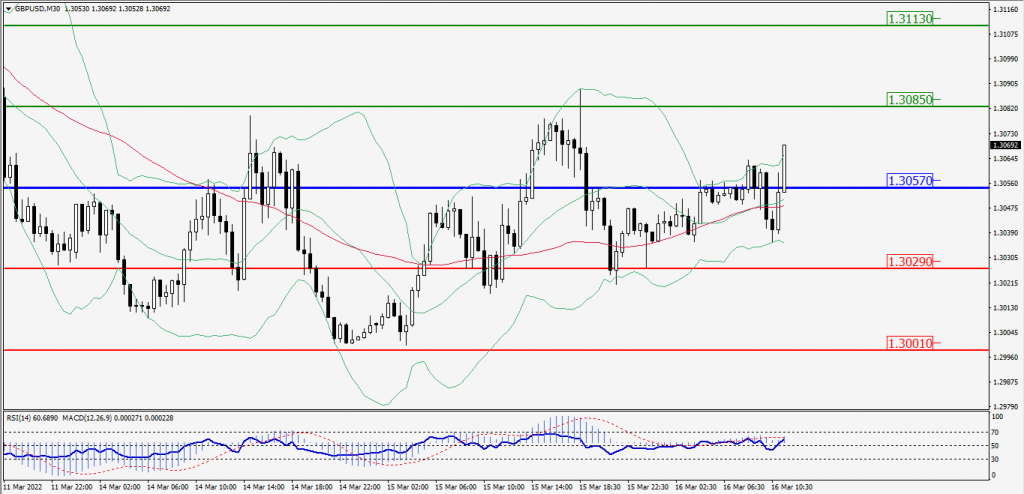
Green Lines Indicate Resistance Levels – Red Lines Indicates Support Levels
Light Blue is a Pivot Point – Black represents the price when the report was produced
USD/JPY Intraday: Trend on the Upside
Our pivot point is at 118.170
Preferable Price Action: Buy position Above pivot with the target at 118.620 and 119.080 in extension.
Alternative Price Action: The Downside breakout of the pivot would call for 117.710 and 117.250.
Comment: MACD in Positive territory and Pair Above its 20MA & 55MA.
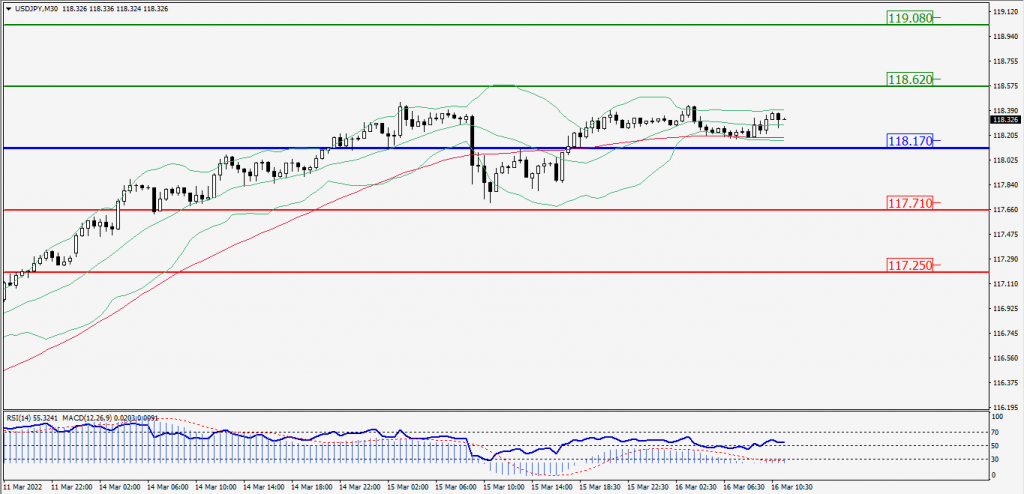
Green Lines Indicate Resistance Levels – Red Lines Indicates Support Levels
Light Blue is a Pivot Point – Black represents the price when the report was produced
AUD/USD Intraday: In a Consolidation Zone
Our pivot point is at 0.72090
Preferable Price Action: Buy Positions Above pivot with targets at 0.72540 & 0.73010 in extension.
Alternative Price Action: Below pivot looks for a further Downside with 0.71590 & 0.71130 as targets.
Comment: RSI above 50 levels and Pair Above its 20MA & 55MA.
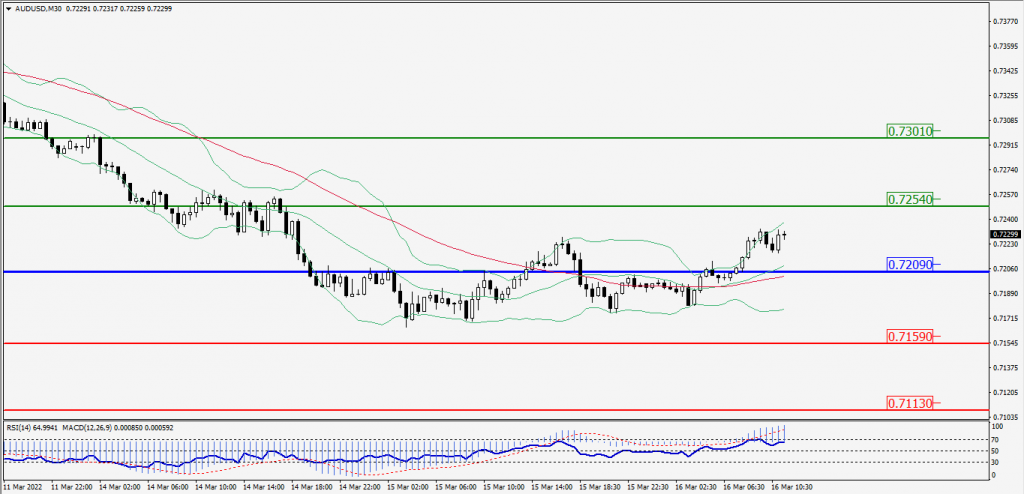
Green Lines Indicate Resistance Levels – Red Lines Indicates Support Levels
Light Blue is a Pivot Point – Black represents the price when the report was produced
CRUDEOIL Intraday: In a Consolidation Zone
Our pivot point is at 96.15
Preferable Price Action: Above pivots Buy Oil with 100.10 & 104.20 as targets.
Alternative Price Action: Sell crude Below pivot with targets at 91.85 and 87.75 in extension.
Comment: MACD is in the positive territory and Pair Above its 20MA & 55MA.
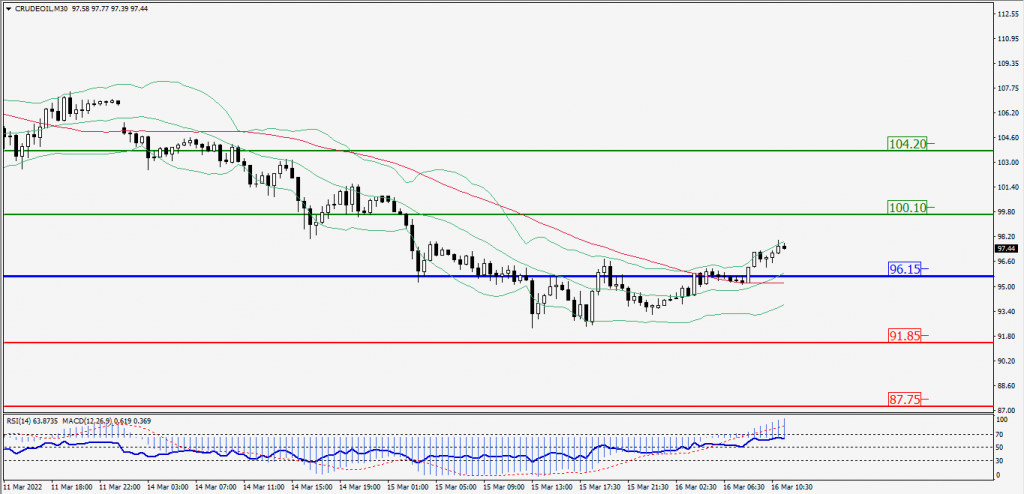
Green Lines Indicate Resistance Levels – Red Lines Indicates Support Levels
Light Blue is a Pivot Point – Black represents the price when the report was produced
XAU/USD Intraday: Trend on the Downside
Our pivot point is 1936.90
Preferable Price Action: Further Downside to 1903.30 and 1871.60.
Alternative Price Action: If the price gives an Upside breakout of a pivot, then the price extends to 1968.10 and 2000.70.
Comment: MACD is a negative territory and Pair Below its 20MA & 55MA.
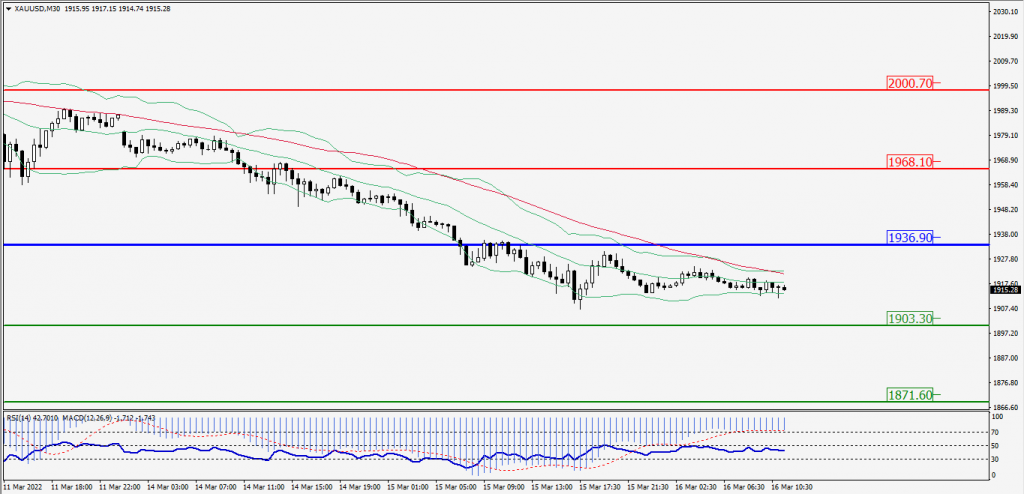
Green Lines Indicate Resistance Levels – Red Lines Indicates Support Levels
Light Blue is a Pivot Point – Black represents the price when the report was produced
Dow Jones Intraday: Trend on the Upside
Our pivot point is 33,685.00
Preferable Price Action: Take Long positions above pivot with targets at 34,027.00 & 34,315.00.
Alternative Price Action: below 33,685.00 looks for further downside to 33,293.00 & 32,944.00.
Comment: Price Above its 20MA & 55MA and RSI above 50 levels.
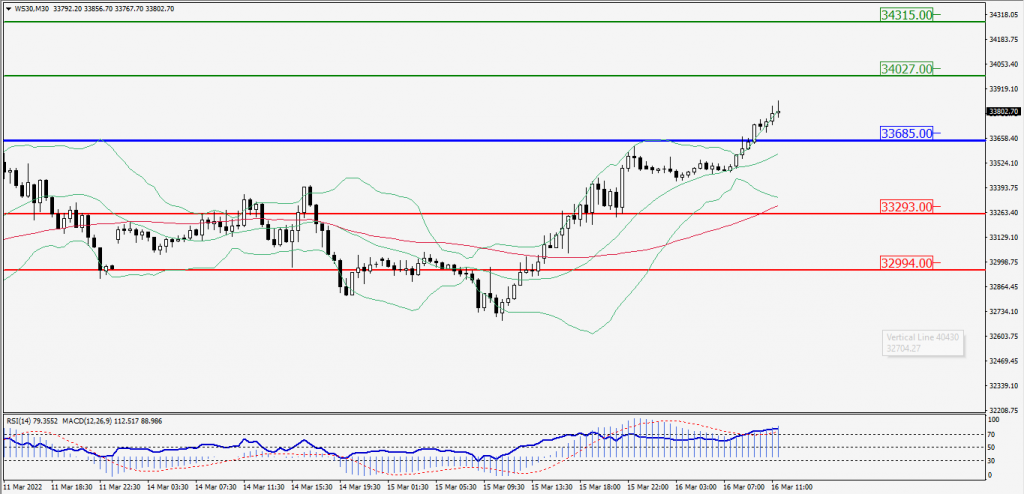
Green Lines Indicate Resistance Levels – Red Lines Indicates Support Levels
Light Blue is a Pivot Point – Black represents the price when the report was produced