Market Wrap: Stocks, Bonds, Commodities
Major US stock indexes closed mostly lower on Monday, led by a more than 2% drop in Nasdaq, as investors sold tech and big growth names ahead of this week’s Federal Reserve meeting and an expected hike in interest rates.
The S&P 500 lose (0.74%) ended at 4,173.11 points, while the Nasdaq Composite decline 2.04% to 12,581.22. The Dow Jones Industrial was flat 32,945.24.
MSCI’s index of Asia-Pacific stocks outside Japan is fell 2.87% to 652.29 levels. Australian index lower 0.73% to 7,097.40. Japanese Nikkei Index surge 0.15% to 25,346.48.
European stocks were Negative on Tuesday, with the Stoxx Europe 50 Index down 1.20% to 3,696.25 Germany’s DAX lost 1.19% to 13,763.67, and France’s CAC down 1.02% to 6,304.88, and U.K.’s FTSE 100 drop 1.23% to 7,104.80.
Benchmark 10-year U.S. Treasury fell as demand for safe assets down again, today 10-year bond yields a negative 2.124.
Oil prices fell and European stocks rose on Monday as investors weighed positive comments from ceasefire talks between Russia and Ukraine, while US Treasury yields hit two-and-a-half year highs on expectations of a first US rate hike.
Spot Brent crude oil fell 6.02% to $100.46 per barrel. US West Texas Intermediate crude down 5.75% to $97.09 a barrel.
The yellow metal gold is descended 1.53% to 1,930.75 dollars per ounce.
Market Wrap: Forex
The yen remained under pressure on Tuesday and the euro edged higher as talks between Russian and Ukrainian negotiators continued, but moves were more muted than in recent days as the market’s attention turned to this week’s Fed meeting.
Today, the U.S. dollar index measures the Redback against a trade-weighted basket of six major currencies, which is fell 0.08% to 98.940.
The Euro US Dollar (EUR/USD) is a widely traded pair that is positive today. This left the pair trading around $1.1015.
The Japanese yen was positive against the U.S. dollar on Tuesday as the stock up. Today USD/JPY is rose 0.15% to 118.350 level.
Another commodity-related currency negative against the U.S dollar, AUD/USD down 0.22% to 0.71710, and NZD/USD fell 0.22% to 0.67300 level.
EUR/USD Intraday: In a Consolidation Zone
Our pivot point is at 1.09620
Preferable Price Action: Take Long positions above pivot level with targets at 1.10170 & 1.10740 in extension.
Alternative Price Action: Below pivot looks for a further downside to 1.09060 & 1.08490.
Comment: RSI above 50 levels and Pair above its 20MA & 55MA.
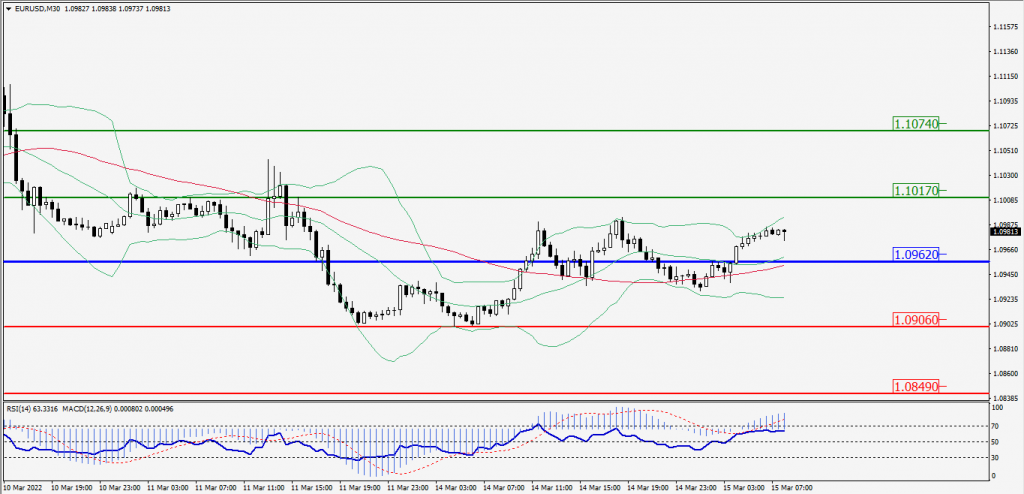
Green Lines Indicate Resistance Levels – Red Lines Indicates Support Levels
Light Blue is a Pivot Point – Black represents the price when the report was produced
GBP/USD Intraday: Trend on the Downside
Our pivot point is at 1.30600
Preferable Price Action: Sell positions below pivot with targets at 1.30230 & 1.29860 in extension.
Alternative Price Action: The price above pivot would call for further upside to 1.30980 & 1.31350.
Comment: RSI above 50 levels and Pair above its 20MA & 55MA.
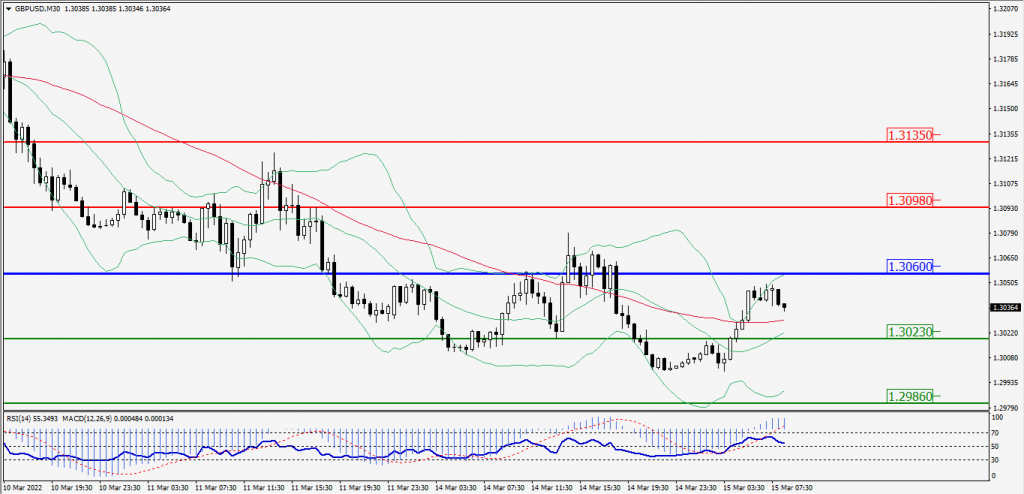
Green Lines Indicate Resistance Levels – Red Lines Indicates Support Levels
Light Blue is a Pivot Point – Black represents the price when the report was produced
USD/JPY Intraday: Trend on the Major Upside
Our pivot point is at 118.090
Preferable Price Action: Buy position Above pivot with the target at 118.660 and 119.090 in extension.
Alternative Price Action: The Downside breakout of the pivot would call for 117.520 and 117.070.
Comment: MACD in Positive territory and Pair Above 55MA.
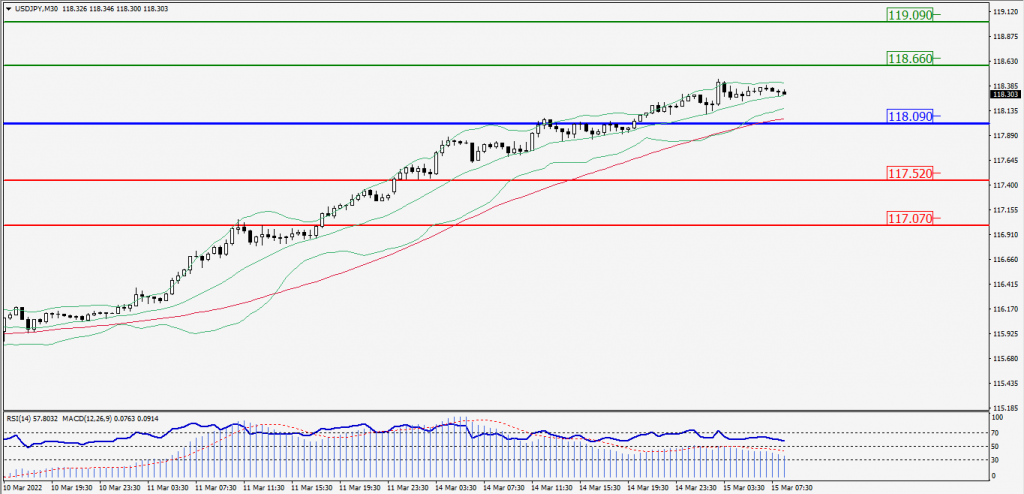
Green Lines Indicate Resistance Levels – Red Lines Indicates Support Levels
Light Blue is a Pivot Point – Black represents the price when the report was produced
AUD/USD Intraday: Trend on the Downside
Our pivot point is at 0.72150
Preferable Price Action: Sell Positions Below pivot with targets at 0.71610 & 0.71080 in extension.
Alternative Price Action: Above pivot looks for a further Upside with 0.72680 & 0.73220 as targets.
Comment: RSI below 50 levels and Pair Below its 20MA & 55MA.
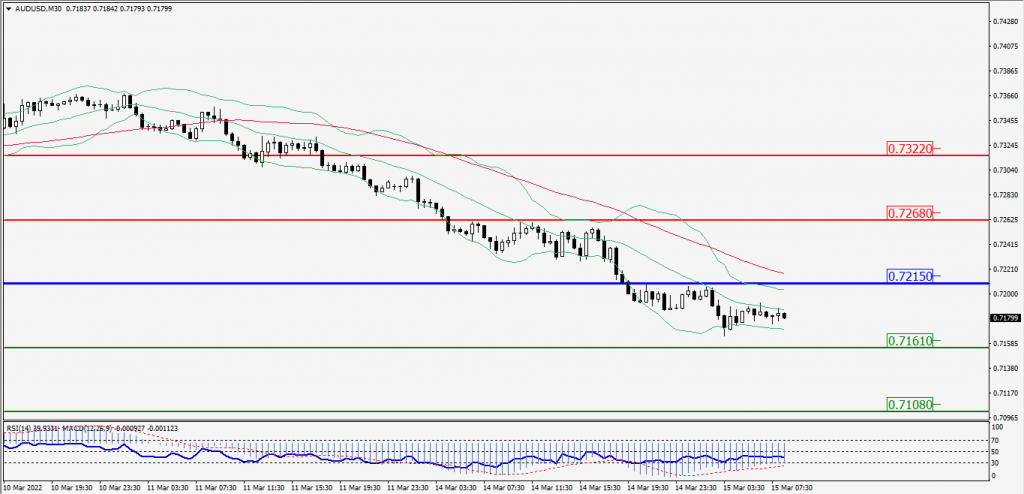
Green Lines Indicate Resistance Levels – Red Lines Indicates Support Levels
Light Blue is a Pivot Point – Black represents the price when the report was produced
CRUDEOIL Intraday: Trend on the Downside
Our pivot point is at 99.15
Preferable Price Action: Below pivots Sell Oil with 94.20 & 89.15 as targets.
Alternative Price Action: Buy crude above pivot with targets at 103.90 and 108.95 in extension.
Comment: MACD is in the negative territory and Pair Below its 20MA & 55MA.
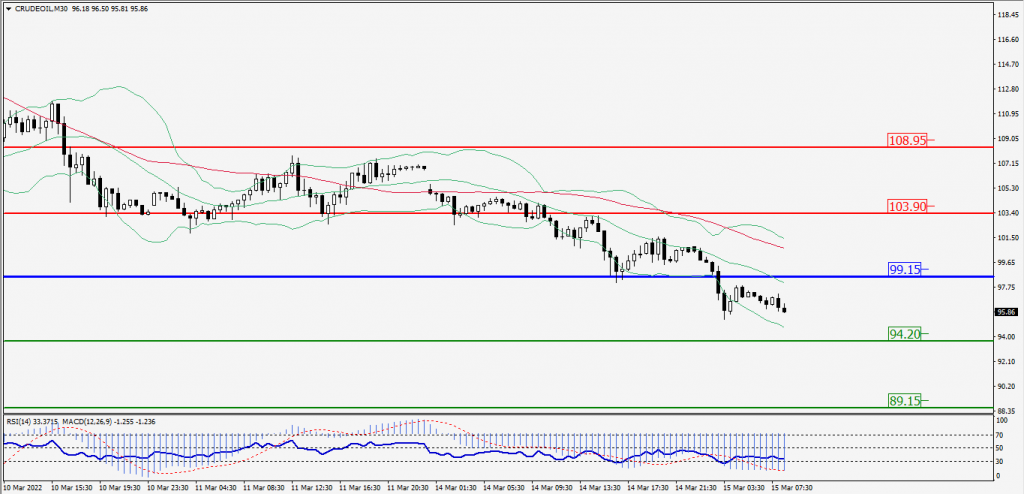
Green Lines Indicate Resistance Levels – Red Lines Indicates Support Levels
Light Blue is a Pivot Point – Black represents the price when the report was produced
XAU/USD Intraday: Trend on the Downside
Our pivot point is 1953.40
Preferable Price Action: Further Downside to 1920.90 and 1892.10.
Alternative Price Action: If the price gives an Upside breakout of a pivot, then the price extends to 1986.90 and 2015.60.
Comment: MACD is a negative territory and Pair Below its 20MA & 55MA.
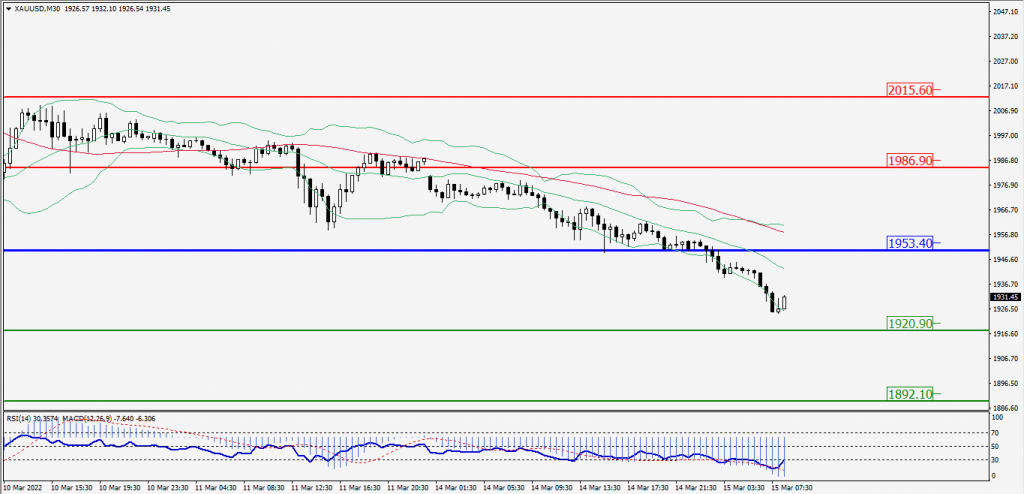
Green Lines Indicate Resistance Levels – Red Lines Indicates Support Levels
Light Blue is a Pivot Point – Black represents the price when the report was produced
Dow Jones Intraday: In a Consolidation Zone
Our pivot point is 33,057.00
Preferable Price Action: Take Short positions below pivot with targets at 32,828.00 & 32,602.00.
Alternative Price Action: Above 33,057.00 looks for further upside to 33,280.00 & 33,509.00.
Comment: Price below its 20MA & 55MA and RSI below 50 levels.
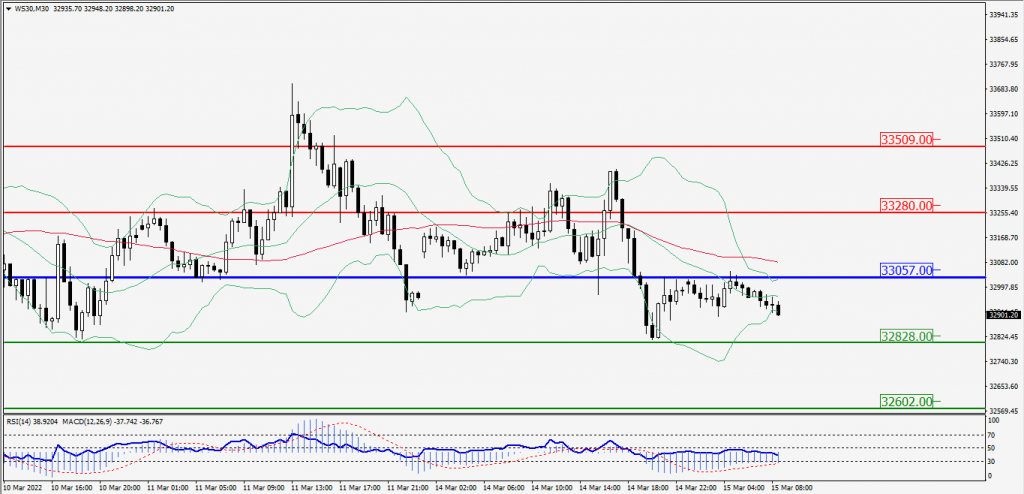
Green Lines Indicate Resistance Levels – Red Lines Indicates Support Levels
Light Blue is a Pivot Point – Black represents the price when the report was produced