Market Wrap: Stocks, Bonds, Commodities
Wall Street ended lower on Friday after escalating tensions in Ukraine and US warnings of a potential Russian invasion prompted investors to dump risky assets in the run-up to a long weekend.
The S&P 500 Lost (0.72%) ended at 4,348.87 points, while the Nasdaq Composite fell 1.23% to 13,548.07. The Dow Jones Industrial was down 0.68% to 34,079.18.
MSCI’s index of Asia-Pacific stocks outside Japan is down 0.52%, to 776.84 levels. Australian index rose 0.16% to 7,233.60. Japanese Nikkei Index fell 0.78% to 26,910.87.
European stocks were Positive on Monday, with the Stoxx Europe 50 Index rose 0.61% to 4,099.15 Germany’s DAX collected 0.89% to 15,176.84, and France’s CAC pulled up 0.63% to 6,973.58, and U.K.’s FTSE 100 gain 0.46% to 7,548.17.
Benchmark 10-year U.S. Treasury fell as demand for safe assets down again, today 10-year bond yields negative 1.927.
Oil prices gained more than $1 in early trade on Monday on rising jitters over the potential conflict between Russia and Ukraine, with the US and European Union making clear Russia would face sanctions if it invaded its neighbour.
Spot Brent crude oil down 0.65% to $90.80 per barrel. US West Texas Intermediate crude fell 0.76% to $89.52 a barrel.
The yellow metal gold fell 0.41% to 1,892.00 dollars per ounce.
Market Wrap: Forex
The U.S. dollar weakened in early European trade Monday as risk sentiment received support from the news of a likely meeting between U.S. President Joe Biden and Russian President Vladimir Putin to discuss the fraught situation on the Ukrainian border.
Today, the U.S. dollar index measures the Redback against a trade-weighted basket of six major currencies, which is fall 0.27% today 95.765.
The Euro US Dollar (EUR/USD) is a widely traded pair that is positive today. This left the pair trading around $1.13790.
The Japanese yen was weak against the U.S. dollar on Monday as the stock down. Today USD/JPY is lost 0.05% at the 114.940 level.
Another commodity-related currency positive against the U.S dollar, AUD/USD rose 0.61% to 0.72170, and NZD/USD Gained 0.34% to 0.67220 level.
EUR/USD Intraday: In a Consolidation Zone
Our pivot point is at 1.13560
Preferable Price Action: Take Long positions Above pivot level with targets at 1.13830 & 1.14060 in extension.
Alternative Price Action: Below pivot looks for a further Downside to 1.13280 & 1.13060.
Comment: RSI Above 50 levels and Pair above its 20MA & 55MA.
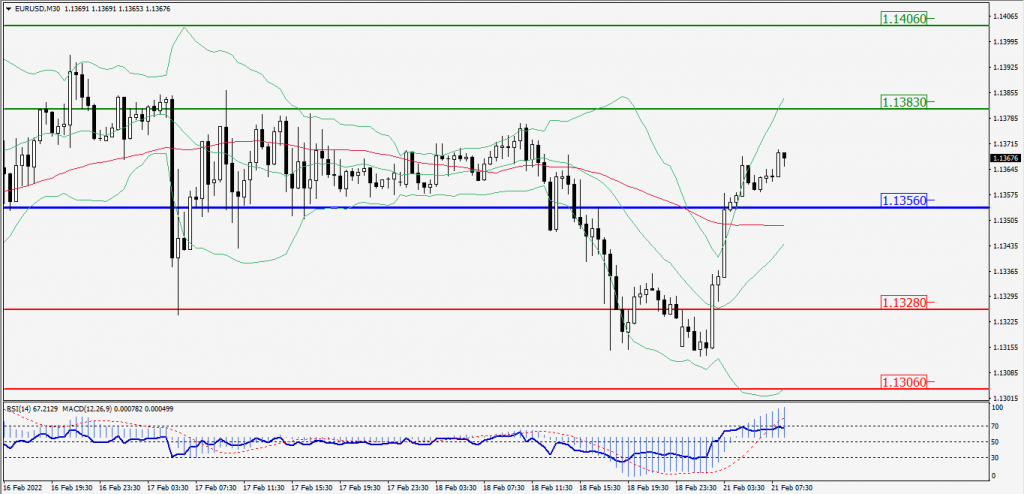
Green Lines Indicate Resistance Levels – Red Lines Indicates Support Levels
Light Blue is a Pivot Point – Black represents the price when the report was produced
GBP/USD Intraday: Support Level at 1.36070
Our pivot point is at 1.36070
Preferable Price Action: Buy positions Above pivot with targets at 1.36420 & 1.36710 in extension.
Alternative Price Action: The price Below pivot would call for further Downside to 1.35710 & 1.35410.
Comment: RSI above 50 levels and Pair above its 55MA & 20MA.
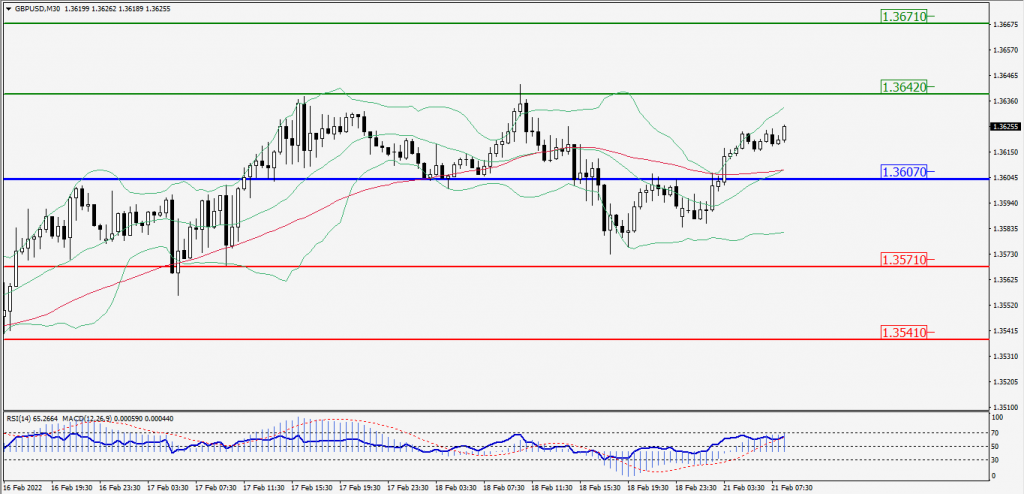
Green Lines Indicate Resistance Levels – Red Lines Indicates Support Levels
Light Blue is a Pivot Point – Black represents the price when the report was produced
USD/JPY Intraday: Trend on the Downside
Our pivot point is at 115.110
Preferable Price Action: Sell position Below pivot with the target at 114.840 and 114.620 in extension.
Alternative Price Action: The Upside breakout of the pivot would call for 115.370 and 115.590.
Comment: MACD in Negative territory and Pair Below its 20MA & 55MA.
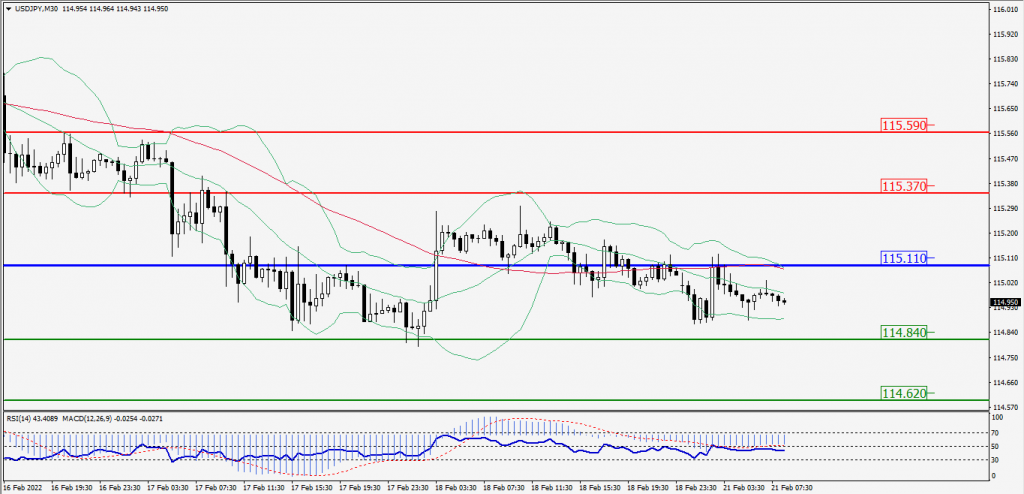
Green Lines Indicate Resistance Levels – Red Lines Indicates Support Levels
Light Blue is a Pivot Point – Black represents the price when the report was produced
AUD/USD Intraday: Support Level at 0.71980
Our pivot point is at 0.71980
Preferable Price Action: Buy Positions Above pivot with targets at 0.72490 & 0.72910 in extension.
Alternative Price Action: Below pivot looks for a further Downside with 0.71490 & 0.71090 as targets.
Comment: Pair Above its 20MA & 55MA and RSI above 50 levels.
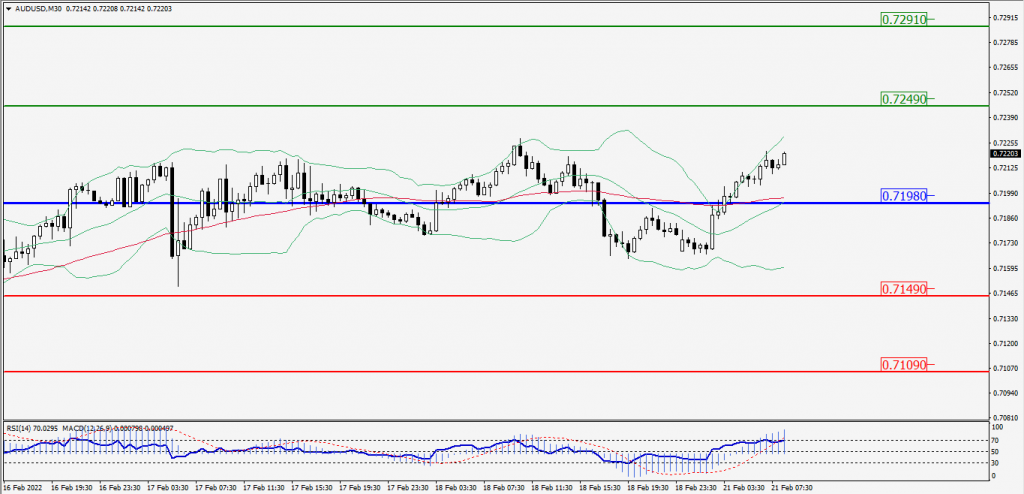
Green Lines Indicate Resistance Levels – Red Lines Indicates Support Levels
Light Blue is a Pivot Point – Black represents the price when the report was produced
CRUDEOIL Intraday: In a Consolidation Zone
Our pivot point is at 89.25
Preferable Price Action: Above pivots Buy Oil with 90.30 & 91.15 as targets.
Alternative Price Action: Sell crude Below pivot with targets at 88.25 and 87.45 in extension.
Comment: MACD is in the Neutral territory and Pair Above 55MA.
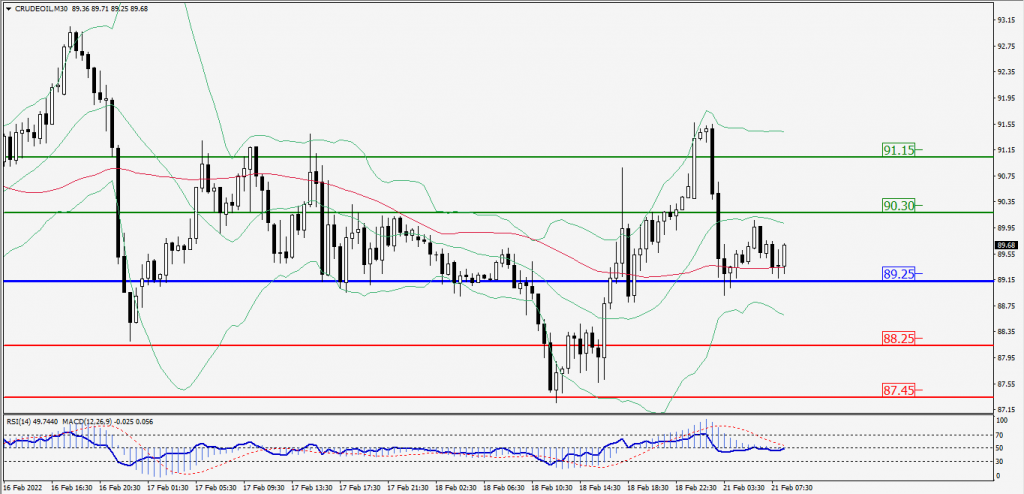
Green Lines Indicate Resistance Levels – Red Lines Indicates Support Levels
Light Blue is a Pivot Point – Black represents the price when the report was produced
XAU/USD Intraday: Resistance Level at 1897.50
Our pivot point is 1897.50
Preferable Price Action: Further Downside to 1885.50 and 1875.80.
Alternative Price Action: If the price gives an Upside breakout of a pivot, then the price extends to 1909.10 and 1918.80.
Comment: MACD is a Negative territory And Price Below its 20MA & 55MA.
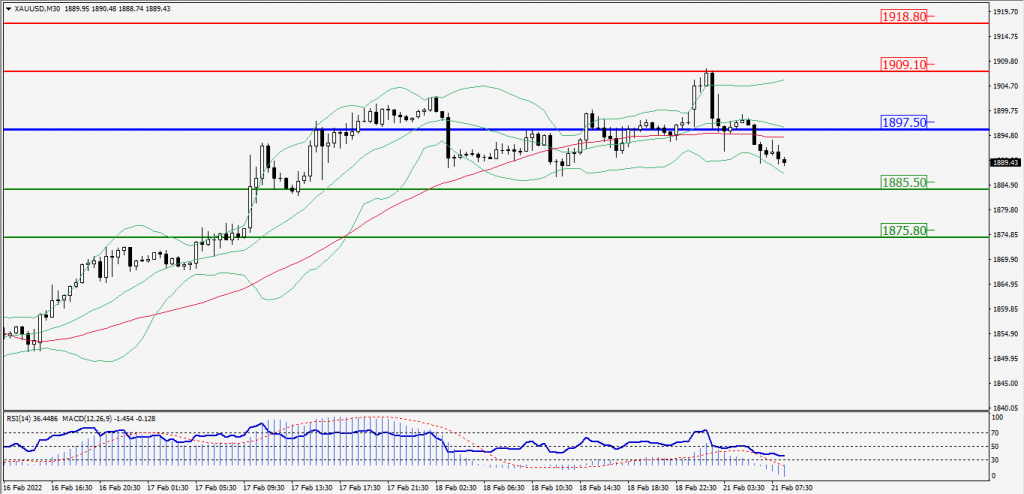
Green Lines Indicate Resistance Levels – Red Lines Indicates Support Levels
Light Blue is a Pivot Point – Black represents the price when the report was produced
Dow Jones Intraday: Trend on the Upside
Our pivot point is 34,250.00
Preferable Price Action: Take Long positions Above pivot with targets at 34,508.00 & 34,733.00.
Alternative Price Action: Below 34,250.00 looks for further Downside to 33,969.00 & 33,753.00.
Comment: RSI Above 50 levels And Price Above 20MA.
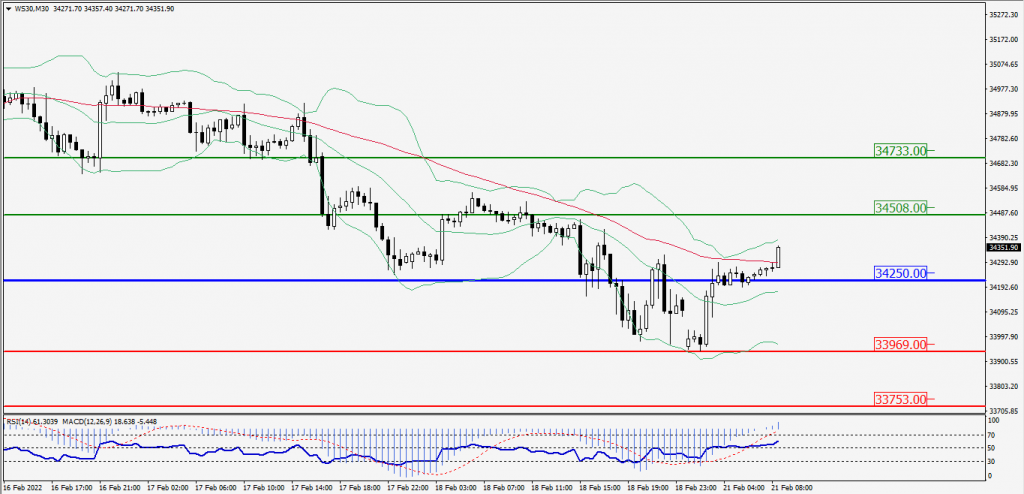
Green Lines Indicate Resistance Levels – Red Lines Indicates Support Levels
Light Blue is a Pivot Point – Black represents the price when the report was produced