Market Wrap: Stocks, Bonds, Commodities
US stocks slid on Friday, with the S&P 500 marking its biggest daily percentage drop in two weeks, as investors shifted to defensive sectors and safe havens such as bonds and gold as geopolitical tensions between Washington and Russia over Ukraine flared.
The S&P 500 Lost (2.12%) ended at 4,380.26 points, while the Nasdaq Composite fell 2.88% to 13,716.72. The Dow Jones Industrial was down 1.78% to 34,312.03.
MSCI’s index of Asia-Pacific stocks outside Japan is down 0.62%, to 782.93 levels. Australian index lost 1.02% to 7,221.70. Japanese Nikkei Index fell 0.41% to 27,122.07.
European stocks were Positive on Friday, with the Stoxx Europe 50 Index rose 0.32% to 4,126.15 Germany’s DAX collected 0.27% to 15,309.46, and France’s CAC pulled up 0.62% to 6,990.20, and U.K.’s FTSE 100 gain 0.32% to 7,561.50.
Benchmark 10-year U.S. Treasury rose as demand for safe assets gain again, today 10-year bond yields advance 1.984.
Oil prices retreated on Friday after wild swings during the week, as the prospect of extra supply from Iran returning to the market outweighed fears of a possible Russian invasion of Ukraine, which could disrupt supply.
Spot Brent crude oil down 0.66% to $92.36 per barrel. US West Texas Intermediate crude fell 0.74% to $91.08 a barrel.
The yellow metal gold fell 0.39% to 1,894.50 dollars per ounce.
Market Wrap: Forex
The safe-haven Japanese yen fell back on Friday and risk-sensitive currencies like the Australian dollar advanced as investors took comfort from news of talks between the United States and Russia over the crisis in Ukraine.
Today, the U.S. dollar index measures the Redback against a trade-weighted basket of six major currencies, which is fall 0.05% today 95.752.
The Euro US Dollar (EUR/USD) is a widely traded pair that is positive today. This left the pair trading around $1.13720.
The Japanese yen was Strong against the U.S. dollar on Friday as the stock up. Today USD/JPY is rose 0.28% at the 115.250 level.
Another commodity-related currency positive against the U.S dollar, AUD/USD rose 0.61% to 0.72270, and NZD/USD Gained 0.61% to 0.67280 level.
EUR/USD Intraday: Major Support Level at 1.13610
Our pivot point is at 1.13610
Preferable Price Action: Take Long positions Above pivot level with targets at 1.13850 & 1.14050 in extension.
Alternative Price Action: Below pivot looks for a further Downside to 1.13360 & 1.13120.
Comment: RSI Above 50 levels nad Pair above its 20MA & 55MA.
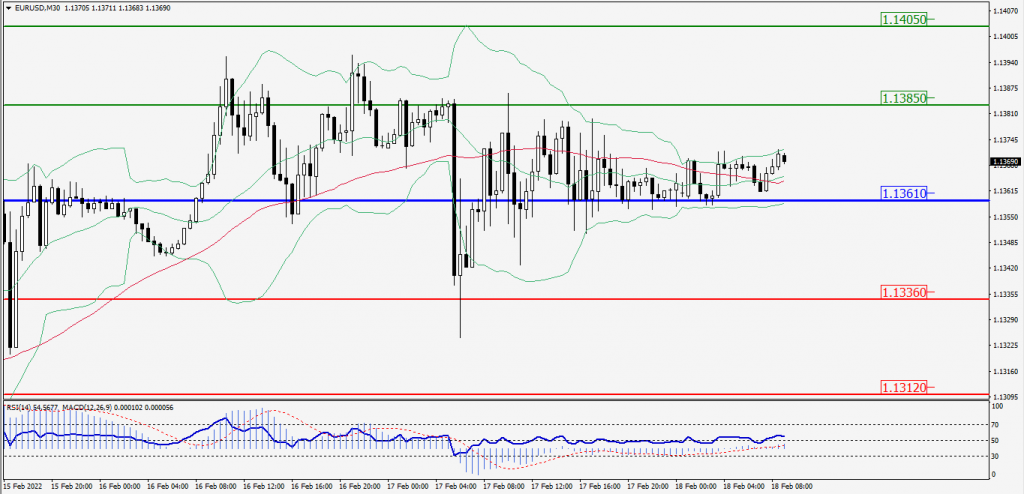
Green Lines Indicate Resistance Levels – Red Lines Indicates Support Levels
Light Blue is a Pivot Point – Black represents the price when the report was produced
GBP/USD Intraday: Trend on the Major Upside
Our pivot point is at 1.35960
Preferable Price Action: Buy positions Above pivot with targets at 1.36350 & 1.36690 in extension.
Alternative Price Action: The price Below pivot would call for further Downside to 1.35560 & 1.35230.
Comment: RSI at 50 levels and Pair above its 55MA & 20MA.
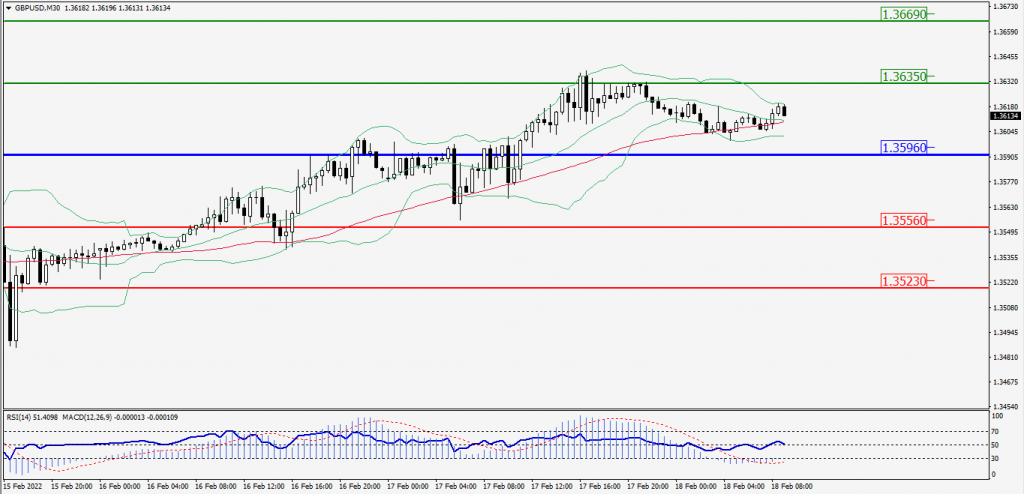
Green Lines Indicate Resistance Levels – Red Lines Indicates Support Levels
Light Blue is a Pivot Point – Black represents the price when the report was produced
USD/JPY Intraday: Trend on the Upside
Our pivot point is at 115.070
Preferable Price Action: Buy position Above pivot with the target at 115.320 and 115.530 in extension.
Alternative Price Action: The Downside breakout of the pivot would call for 114.820 and 114.610.
Comment: MACD in Positive territory and Pair Above its 20MA & 55MA.
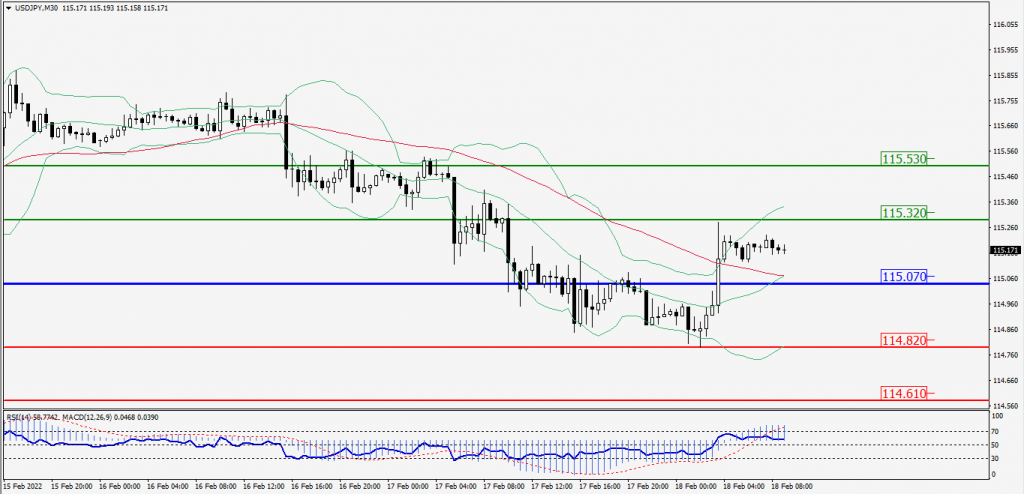
Green Lines Indicate Resistance Levels – Red Lines Indicates Support Levels
Light Blue is a Pivot Point – Black represents the price when the report was produced
AUD/USD Intraday: Support Level at 0.71850
Our pivot point is at 0.71850
Preferable Price Action: Buy Positions Above pivot with targets at 0.72410 & 0.72890 in extension.
Alternative Price Action: Below pivot looks for a further Downside with 0.71290 & 0.70810 as targets.
Comment: Pair Above its 20MA & 55MA and RSI at 50 levels.
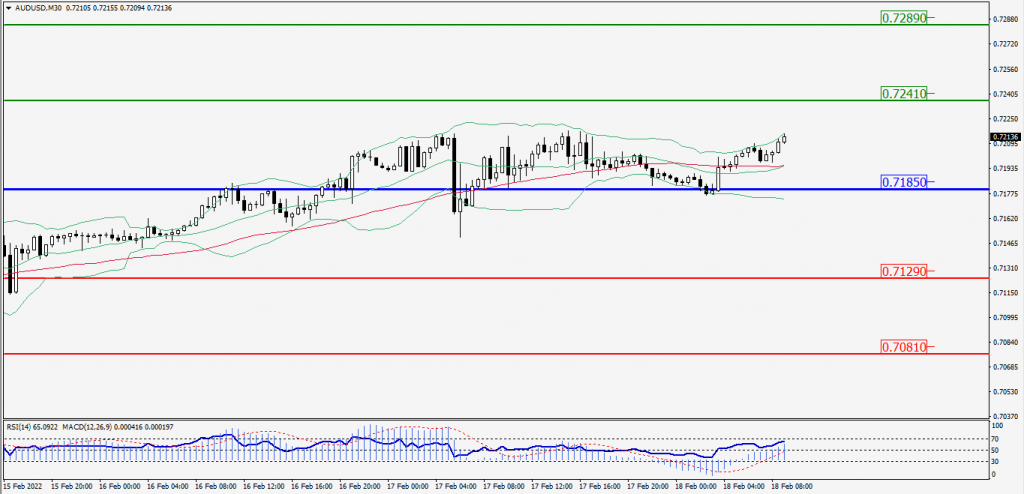
Green Lines Indicate Resistance Levels – Red Lines Indicates Support Levels
Light Blue is a Pivot Point – Black represents the price when the report was produced
CRUDEOIL Intraday: In a Consolidation Zone
Our pivot point is at 90.15
Preferable Price Action: Below pivots Sell Oil with 88.75 & 87.65 as targets.
Alternative Price Action: Buy crude Above pivot with targets at 91.45 and 92.55 in extension.
Comment: MACD is in the Negative territory and Pair Below 55MA.
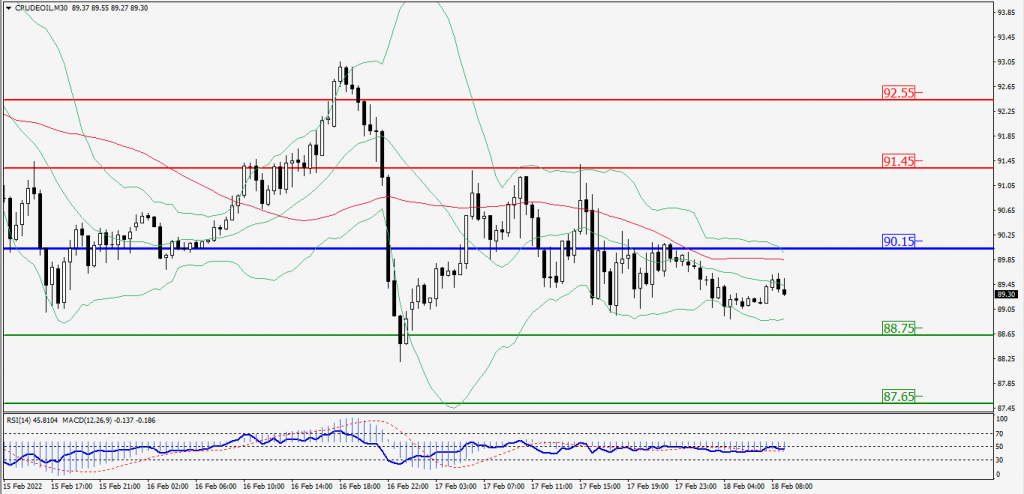
Green Lines Indicate Resistance Levels – Red Lines Indicates Support Levels
Light Blue is a Pivot Point – Black represents the price when the report was produced
XAU/USD Intraday: Trend on the Upside
Our pivot point is 1886.50
Preferable Price Action: Further Upside to 1901.20 and 1912.60.
Alternative Price Action: If the price gives a Downside breakout of a pivot, then the price extends to 1871.50 and 1860.50.
Comment: MACD is a Negative territory And Price Above 55MA.
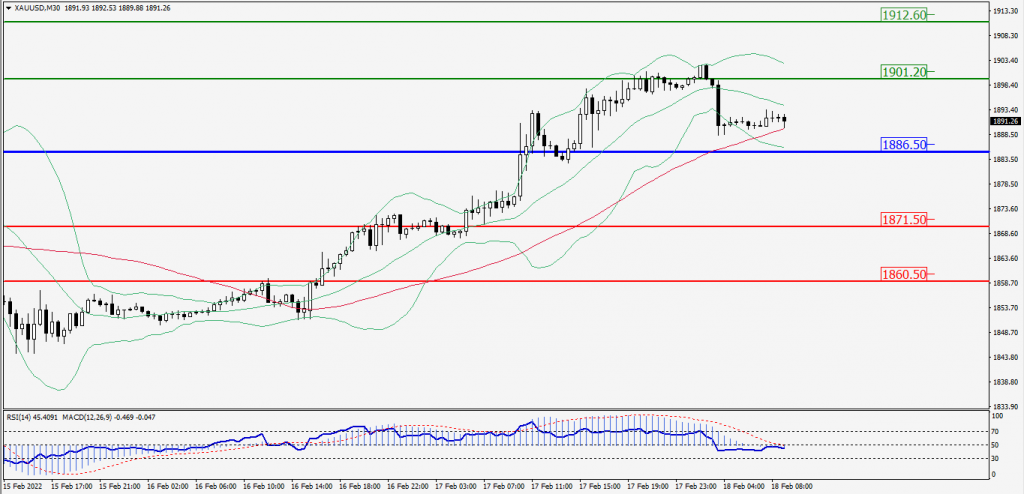
Green Lines Indicate Resistance Levels – Red Lines Indicates Support Levels
Light Blue is a Pivot Point – Black represents the price when the report was produced
Dow Jones Intraday: Resistance Level at 34,620.00
Our pivot point is 34,620.00
Preferable Price Action: Take Short positions Below pivot with targets at 34,352.00 & 34,117.00.
Alternative Price Action: Above 34,620.00 looks for further Upside to 34,894.00 & 35,118.00.
Comment: RSI Below 50 levels And Price Below 55MA.
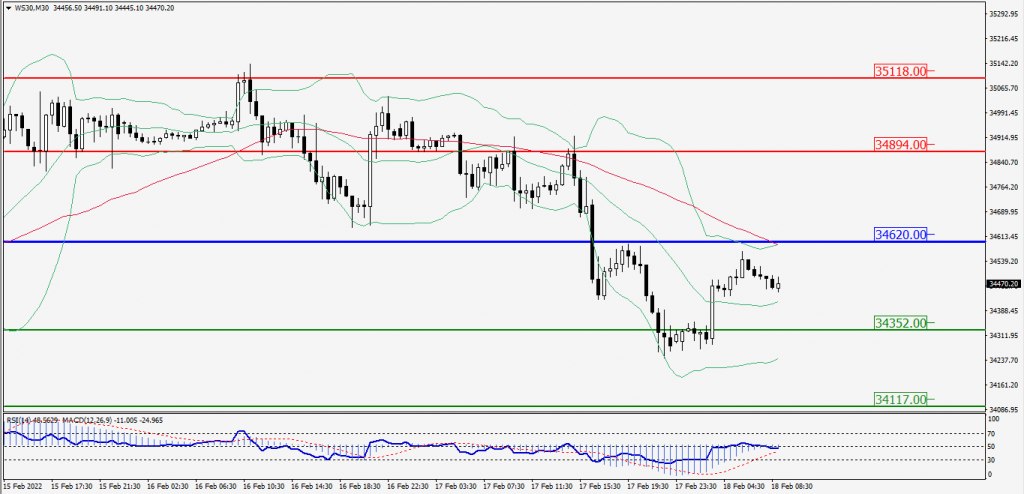
Green Lines Indicate Resistance Levels – Red Lines Indicates Support Levels
Light Blue is a Pivot Point – Black represents the price when the report was produced