Market Wrap: Stocks, Bonds, Commodities
Wall Street bounced off session lows Wednesday with the S&P 500 crossing into positive territory by the closing bell after the US Federal Reserve released meeting minutes, which said that while the central bank intends to begin raising interest rates to combat inflation, its decisions would be made on a meeting-by-meeting basis.
The S&P 500 Gain (0.09%) ended at 4,475.01 points, while the Nasdaq Composite fell 0.11% to 14,124.09. The Dow Jones Industrial was down 0.16% to 34,934.27.
MSCI’s index of Asia-Pacific stocks outside Japan is Up 0.28%, to 787.91 levels. Australian index Gained 0.16% to 7,296.20. Japanese Nikkei Index fell 0.83% to 27,232.87.
European stocks were mixed on Thursday, with the Stoxx Europe 50 Index rose 0.27% to 4,148.55 Germany’s DAX collected 0.16% to 15,394.22, and France’s CAC pulled up 0.44% to 6,995.78, and U.K.’s FTSE 100 lost 0.10% to 7,596.47.
Benchmark 10-year U.S. Treasury fell as demand for safe assets lost again, today 10-year bond yields advance 2.009.
Oil slid more than 2% in early Asian trade on Thursday after both France and Iran said parties are closer to an agreement to salvage Iran’s 2015 nuclear deal with world powers, offsetting ongoing concerns over the situation in Ukraine.
Spot Brent crude oil down 1.11% to $93.76 per barrel. US West Texas Intermediate crude fell 1.02% to $92.70 a barrel.
The yellow metal gold gains 0.33% to 1,877.65 dollars per ounce.
Market Wrap: Forex
The dollar was down on Thursday morning in Asia, alongside the euro. Investors are digesting the U.S. doubts that Russia has withdrawn troops on the border with Ukraine, with fears of an invasion still very much alive.
Today, the U.S. dollar index measures the Greenback against a trade-weighted basket of six major currencies, which is collected 0.14% today 95.835.
The Euro US Dollar (EUR/USD) is a widely traded pair that is positive today. This left the pair trading around $1.13790.
The Japanese yen was Weak against the U.S. dollar on Thursday as the stock down. Today USD/JPY is rose 0.17% at the 115.270 level.
Another commodity-related currency positive against the U.S dollar, AUD/USD rose 0.05% to 0.71960, and NZD/USD Gained 0.28% to 0.66950 level.
EUR/USD Intraday: Trend on the Upside
Our pivot point is at 1.13510
Preferable Price Action: Take Long positions Above pivot level with targets at 1.13850 & 1.14130 in extension.
Alternative Price Action: Below pivot looks for a further Downside to 1.13190 & 1.12890.
Comment: RSI Below 50 levels.
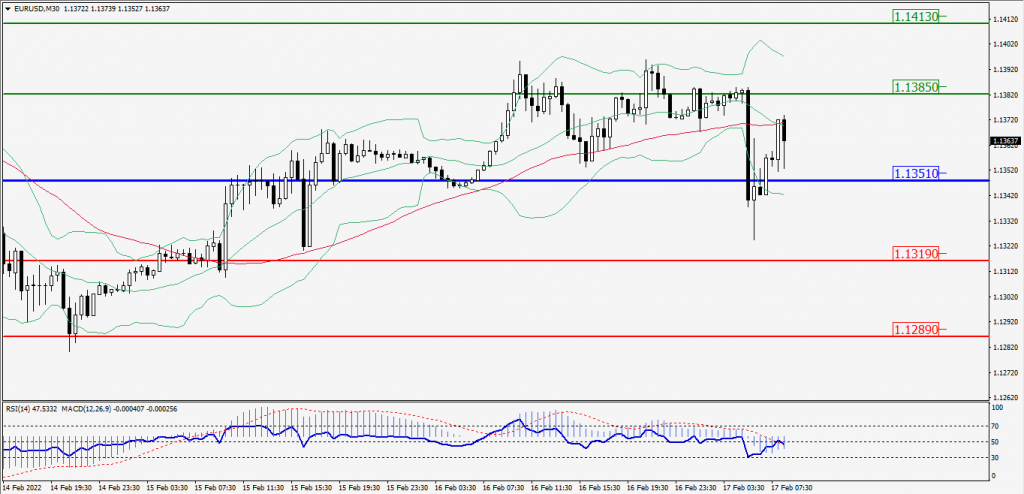
Green Lines Indicate Resistance Levels – Red Lines Indicates Support Levels
Light Blue is a Pivot Point – Black represents the price when the report was produced
GBP/USD Intraday: Support level at 1.35680
Our pivot point is at 1.35680
Preferable Price Action: Buy positions Above pivot with targets at 1.36110 & 1.36410 in extension.
Alternative Price Action: The price Below pivot would call for further Downside to 1.35290 & 1.34960.
Comment: RSI above 50 levels and Pair above its 55MA & 20MA.
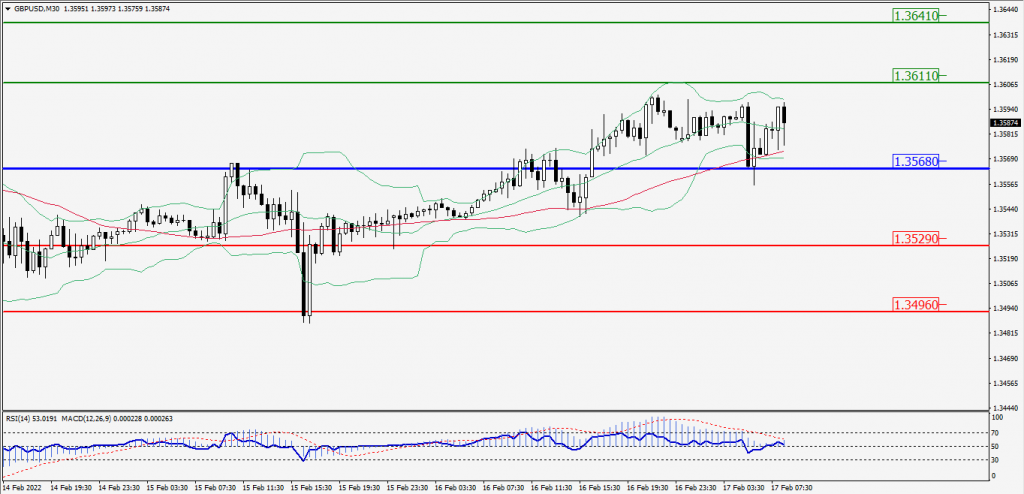
Green Lines Indicate Resistance Levels – Red Lines Indicates Support Levels
Light Blue is a Pivot Point – Black represents the price when the report was produced
USD/JPY Intraday: In a Consolidation Zone
Our pivot point is at 115.480
Preferable Price Action: Sell position Below pivot with the target at 115.190 and 114.960 in extension.
Alternative Price Action: The Upside breakout of the pivot would call for 115.760 and 116.000.
Comment: MACD in Negative territory and Pair Below its 20MA & 55MA.
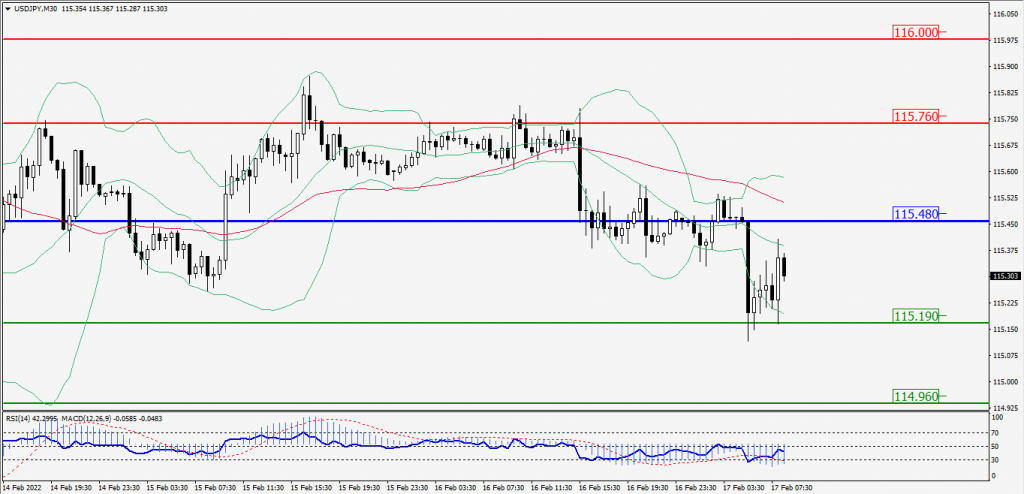
Green Lines Indicate Resistance Levels – Red Lines Indicates Support Levels
Light Blue is a Pivot Point – Black represents the price when the report was produced
AUD/USD Intraday: Trend on the Upside
Our pivot point is at 0.71680
Preferable Price Action: Buy Positions Above pivot with targets at 0.72210 & 0.72590 in extension.
Alternative Price Action: Below pivot looks for a further Downside with 0.71190 & 0.70780 as targets.
Comment: Pair Above 55MA and RSI at 50 levels.
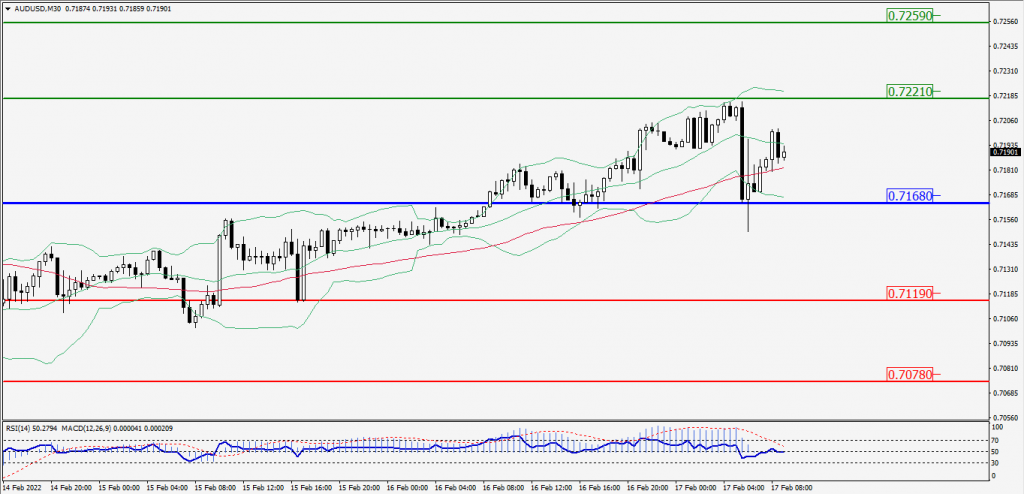
Green Lines Indicate Resistance Levels – Red Lines Indicates Support Levels
Light Blue is a Pivot Point – Black represents the price when the report was produced
CRUDEOIL Intraday: In a Consolidation Zone
Our pivot point is at 90.95
Preferable Price Action: Below pivots Sell Oil with 89.75 & 88.95 as targets.
Alternative Price Action: Buy crude Above pivot with targets at 92.15 and 92.95 in extension.
Comment: MACD is in the Neutral territory and Pair Below 55MA.
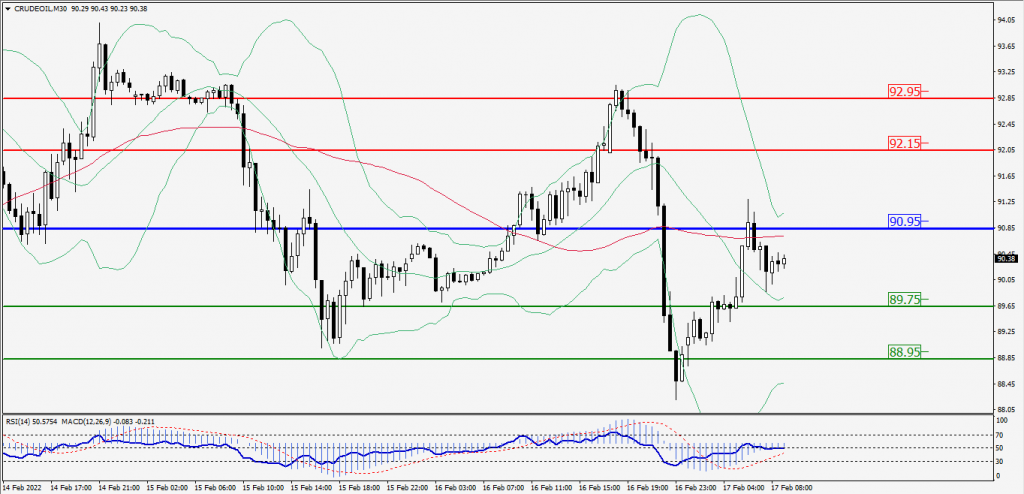
Green Lines Indicate Resistance Levels – Red Lines Indicates Support Levels
Light Blue is a Pivot Point – Black represents the price when the report was produced
XAU/USD Intraday: Trend on the Upside
Our pivot point is 1870.10
Preferable Price Action: Further Upside to 1882.90 and 1894.20.
Alternative Price Action: If the price gives a Downside breakout of a pivot, then the price extends to 1856.20 and 1845.50.
Comment: MACD is a Positive territory And Price Above its 20MA & 55MA.
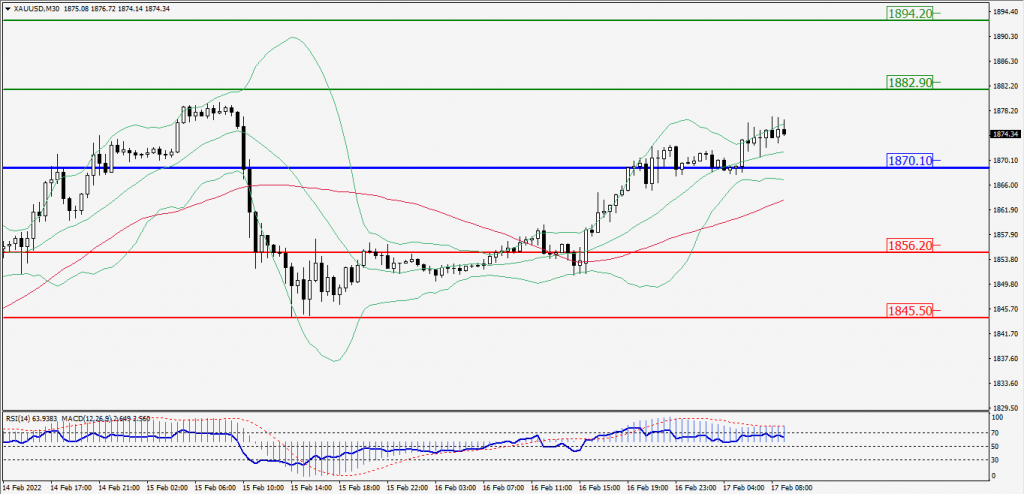
Green Lines Indicate Resistance Levels – Red Lines Indicates Support Levels
Light Blue is a Pivot Point – Black represents the price when the report was produced
Dow Jones Intraday: Resistance Level at 34,968.00
Our pivot point is 34,968.00
Preferable Price Action: Take Short positions Below pivot with targets at 34,739.00 & 34,557.00.
Alternative Price Action: Above 34,968.00 looks for further Upside to 35,196.00 & 35,378.00.
Comment: RSI Below 50 levels And Price Below its 20MA & 55MA.
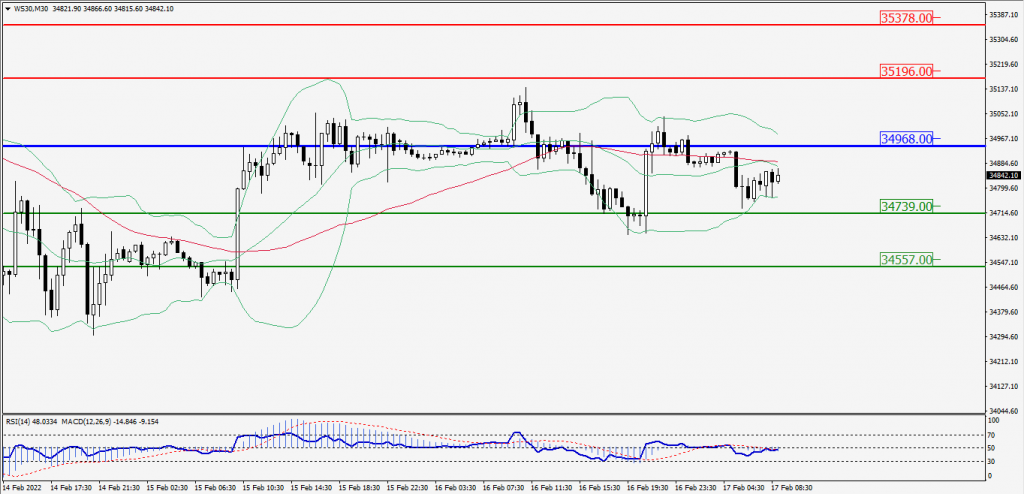
Green Lines Indicate Resistance Levels – Red Lines Indicates Support Levels
Light Blue is a Pivot Point – Black represents the price when the report was produced