Market Wrap: Stocks, Bonds, Commodities
Wall Street ended sharply higher on Wednesday, as signs of de-escalating tensions along the Russia-Ukraine border sparked a risk-on session.
The S&P 500 Gain (1.58%) ended at 4,471.07 points, while the Nasdaq Composite rose 2.53% to 14,139.76. The Dow Jones Industrial was up 1.22% to 34,988.84.
MSCI’s index of Asia-Pacific stocks outside Japan is Up 1.42%, to 787.45 levels. Australian index Gained 1.08% to 7,284.90. Japanese Nikkei Index Rose 2.22% to 27,460.40.
European stocks were Positive on Wednesday, with the Stoxx Europe 50 Index rose 0.66% to 4,171.25 Germany’s DAX collected 0.53% to 15,494.63, and France’s CAC pulled up 0.59% to 7,021.40, and U.K.’s FTSE 100 gained 0.12% to 7,617.97.
Benchmark 10-year U.S. Treasury neutral as demand for safe assets no change again, today 10-year bond yields advance 2.049.
Oil prices recouped losses on Wednesday after slipping more than 3% in the previous session, as investors gauged the impact of easing Russia-Ukraine tension against a taut balance of tight global supplies and recovering fuel demand.
Spot Brent crude oil rose 1.20% to $94.40 per barrel. US West Texas Intermediate crude up 1.10% to $93.08 a barrel.
The yellow metal gold gains 0.09% to 1,857.75 dollars per ounce.
Market Wrap: Forex
The U.S. dollar edged lower Wednesday, continuing the previous session’s selloff as news of the withdrawal of some Russian troops from the Ukraine border drained some geopolitical risk premium from the market.
Today, the U.S. dollar index measures the redback against a trade-weighted basket of six major currencies, which is lost 0.16% today 95.835.
The Euro US Dollar (EUR/USD) is a widely traded pair that is positive today. This left the pair trading around $1.13800.
The Japanese yen was Strong against the U.S. dollar on Wednesday as the stock up. Today USD/JPY is rose 0.11% at the 115.750 level.
Another commodity-related currency positive against the U.S dollar, AUD/USD rosed 0.33% to 0.71750, and NZD/USD Gained 0.21% to 0.66530 level.
EUR/USD Intraday: Trend on the Upside
Our pivot point is at 1.13550
Preferable Price Action: Take Long positions Above pivot level with targets at 1.13880 & 1.14140 in extension.
Alternative Price Action: Below pivot looks for a further Downside to 1.13230 & 1.12960.
Comment: Pair above its 20MA & 55MA and RSI above 50 levels.
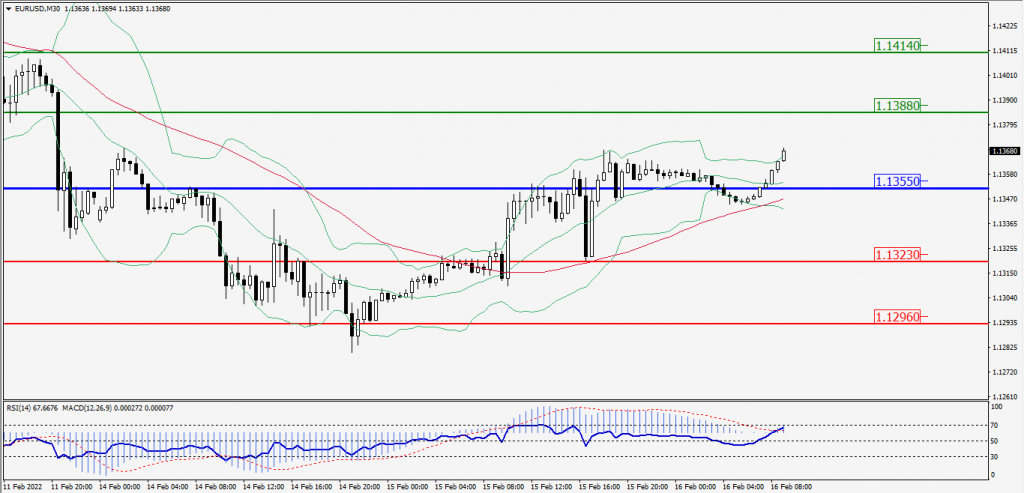
Green Lines Indicate Resistance Levels – Red Lines Indicates Support Levels
Light Blue is a Pivot Point – Black represents the price when the report was produced
GBP/USD Intraday: In a Consolidation Zone
Our pivot point is at 1.35390
Preferable Price Action: Buy positions Above pivot with targets at 1.35880 & 1.36250 in extension.
Alternative Price Action: The price Below pivot would call for further Downside to 1.34920 & 1.34580.
Comment: RSI above 50 levels and Pair above its 20MA & 55MA.
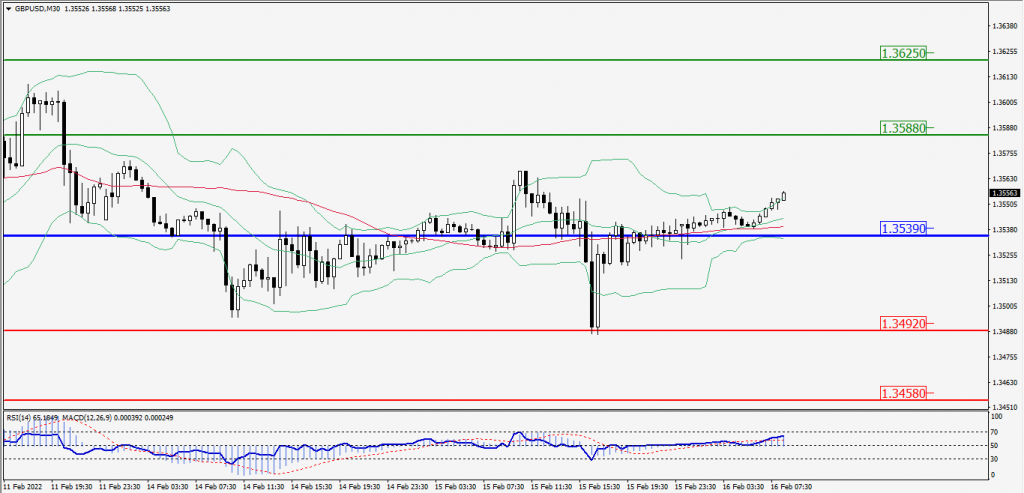
Green Lines Indicate Resistance Levels – Red Lines Indicates Support Levels
Light Blue is a Pivot Point – Black represents the price when the report was produced
USD/JPY Intraday: In a Consolidation Zone
Our pivot point is at 115.530
Preferable Price Action: Buy position Above pivot with the target at 115.820 and 116.060 in extension.
Alternative Price Action: The Downside breakout of the pivot would call for 115.250 and 115.010.
Comment: MACD in Neutral territory and Pair Above 55MA.
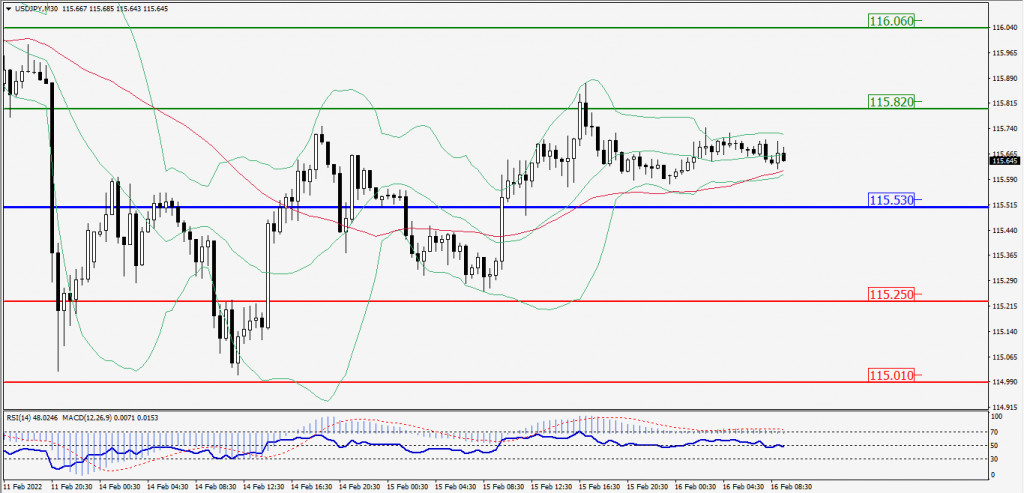
Green Lines Indicate Resistance Levels – Red Lines Indicates Support Levels
Light Blue is a Pivot Point – Black represents the price when the report was produced
AUD/USD Intraday: Support Level at 0.71460
Our pivot point is at 0.71460
Preferable Price Action: Buy Positions Above pivot with targets at 0.72020 & 0.72480 in extension.
Alternative Price Action: Below pivot looks for a further Downside with 0.70880 & 0.70430 as targets.
Comment: Pair Above its 20MA & 55MA and RSI above 50 levels.
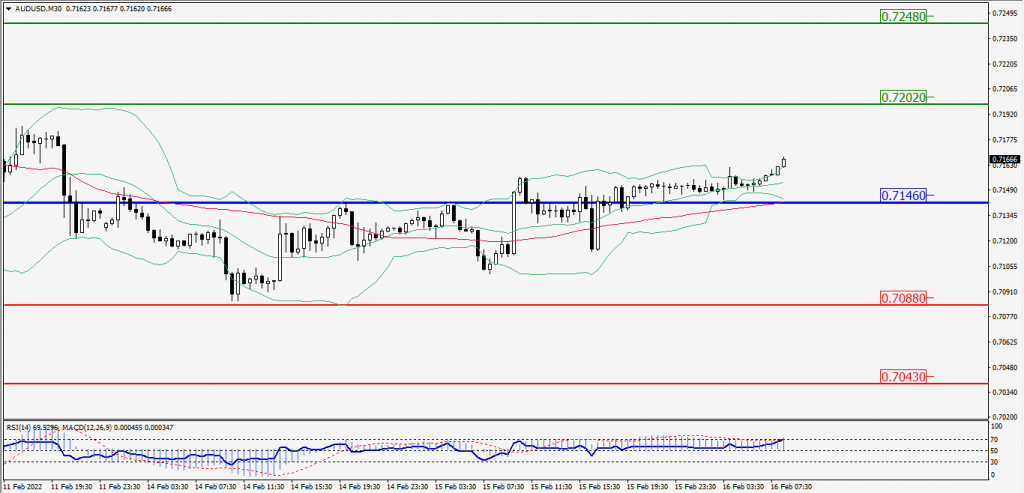
Green Lines Indicate Resistance Levels – Red Lines Indicates Support Levels
Light Blue is a Pivot Point – Black represents the price when the report was produced
CRUDEOIL Intraday: In a Consolidation Zone
Our pivot point is at 91.25
Preferable Price Action: Below pivots Sell Oil with 90.15 & 89.30 as targets.
Alternative Price Action: Buy crude Above pivot with targets at 92.25 and 93.15 in extension.
Comment: MACD is in the Positive territory and Pair Below 55MA.
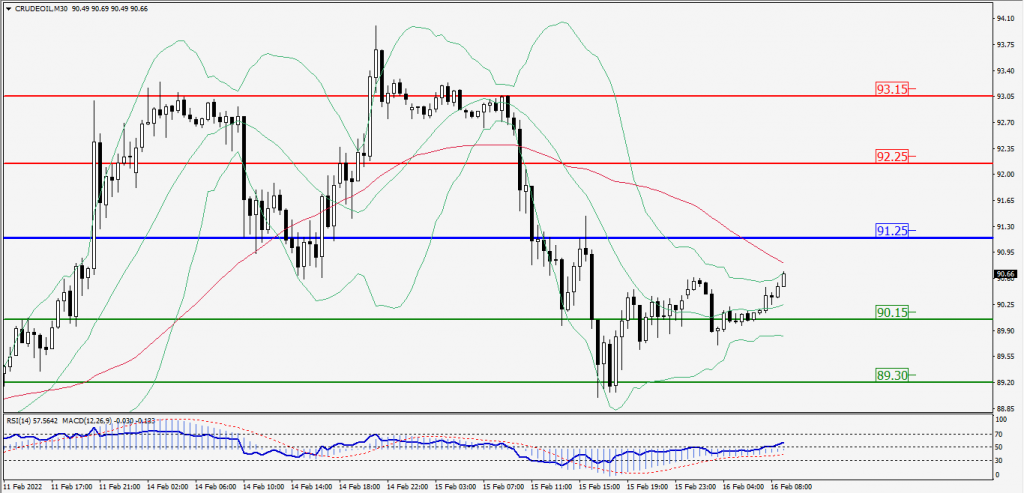
Green Lines Indicate Resistance Levels – Red Lines Indicates Support Levels
Light Blue is a Pivot Point – Black represents the price when the report was produced
XAU/USD Intraday: Trend on the Downside
Our pivot point is 1868.90
Preferable Price Action: Further Downside to 1846.90 and 1828.10.
Alternative Price Action: If the price gives an Upside breakout of a pivot, then the price extends to 1890.90 and 1809.10.
Comment: MACD is a Positive territory And Price Below 55MA.
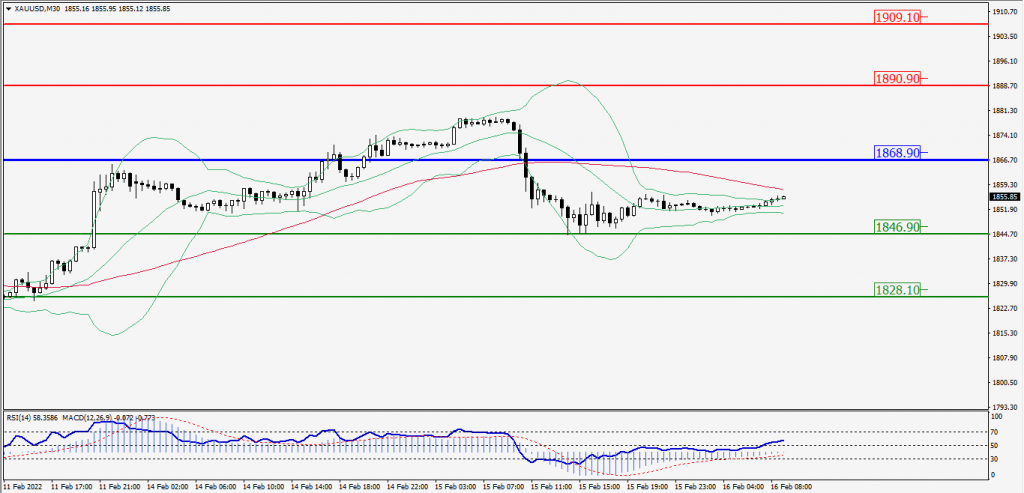
Green Lines Indicate Resistance Levels – Red Lines Indicates Support Levels
Light Blue is a Pivot Point – Black represents the price when the report was produced
Dow Jones Intraday: Trend on the Upside
Our pivot point is 34,903.80
Preferable Price Action: Take Long positions Above pivot with targets at 35,153.10 & 35,340.80.
Alternative Price Action: Below 34,903.80 looks for further Downside to 34,647.10 & 34,424.70.
Comment: RSI Above 50 levels And Price Above its 20MA & 55MA.
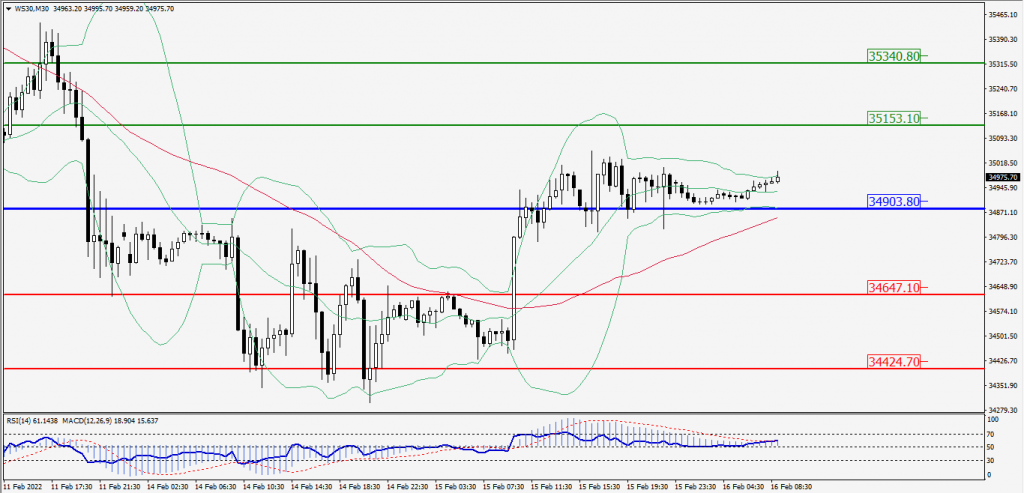
Green Lines Indicate Resistance Levels – Red Lines Indicates Support Levels
Light Blue is a Pivot Point – Black represents the price when the report was produced