Market Wrap: Stocks, Bonds, Commodities
U.S. stocks retreated Thursday, erasing strong gains, after the Federal Reserve signaled an interest rate hike could be coming soon, while supply concerns stemming from tension between Russia and Ukraine saw oil prices touch highs not seen since 2014.
The S&P 500 Lost (0.15%) ended at 4,349.93 points, while the Nasdaq Composite flat to 13,542.10. The Dow Jones Industrial was down (0.38%) to 34,168.09.
MSCI’s index of Asia-Pacific stocks outside Japan is down 2.04%, to 756.87 levels. Australian index drops 1.77% to 6,838.30. Japanese Nikkei Index fell 3.11% to 26,170.30.
European stocks were negative on Thursday, with the Stoxx Europe 50 Index down 1.30% to 4,110.45 Germany’s DAX stair down 1.39% to 15,243.89, and France’s CAC pull down 0.86% to 6,921.63, and U.K.’s FTSE 100 pulled higher 0.03% to 7,471.40.
Benchmark 10-year U.S. Treasury ascend as demand for safe assets gains again, today 10-year bond yields rose 1.848.
Oil rose on Thursday, touching $90 a barrel for the first time in seven years as tight supply and rising political tensions between Russia and Ukraine added to concerns about further disruption in an already-tight market.
Spot Brent crude oil loosed 0.10% to $88.65 per barrel. US West Texas Intermediate crude up 0.11% to $87.25 a barrel.
The yellow metal gold declines 1.02% to 1,811.10 dollars per ounce.
Market Wrap: Forex
The dollar rose to multi-week highs against other major currencies on Thursday, after Federal Reserve chair Jerome Powell surprised investors by leaving the door open to larger and faster than expected interest rate hikes.
Today, the U.S. dollar index measures the greenback against a trade-weighted basket of six major currencies, which is raised at 96.820.
The Euro US Dollar (EUR/USD) is a widely traded pair that is lost today. This left the pair trading around $1.12010.
The Japanese yen was strong against the U.S. dollar on Thursday as the stock pulled. Today USD/JPY is rose 0.25% at the 114.920 level.
Another commodity-related currency negative against the U.S dollar, AUD/USD left 0.46% to 0.70810, and NZD/USD fell 0.67 to 0.66070 level.
EUR/USD Intraday: Trend on the Downside
Our pivot point is at 1.12440
Preferable Price Action: Take Short positions Below pivot level with targets at 1.11890 & 1.11510 in extension.
Alternative Price Action: Above pivot looks for a further Upside to 1.12990 & 1.13370.
Comment: Pair Below its 20MA & 55MA and RSI below 50 levels.
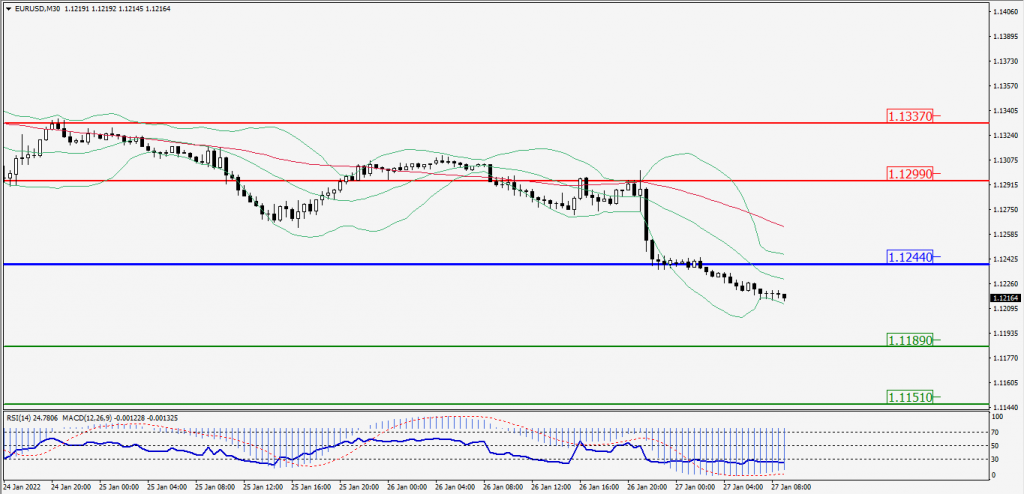
Green Lines Indicate Resistance Levels – Red Lines Indicates Support Levels
Light Blue is a Pivot Point – Black represents the price when the report was produced
GBP/USD Intraday: Resistance at 1.34560
Our pivot point is at 1.34560
Preferable Price Action: Sell positions Below pivot with targets at 1.34050 & 1.33590 in extension.
Alternative Price Action: The price Above pivot would call for further Upside to 1.35070 & 1.35530.
Comment: Pair Below 55MA & 20MA and RSI below 50 levels.
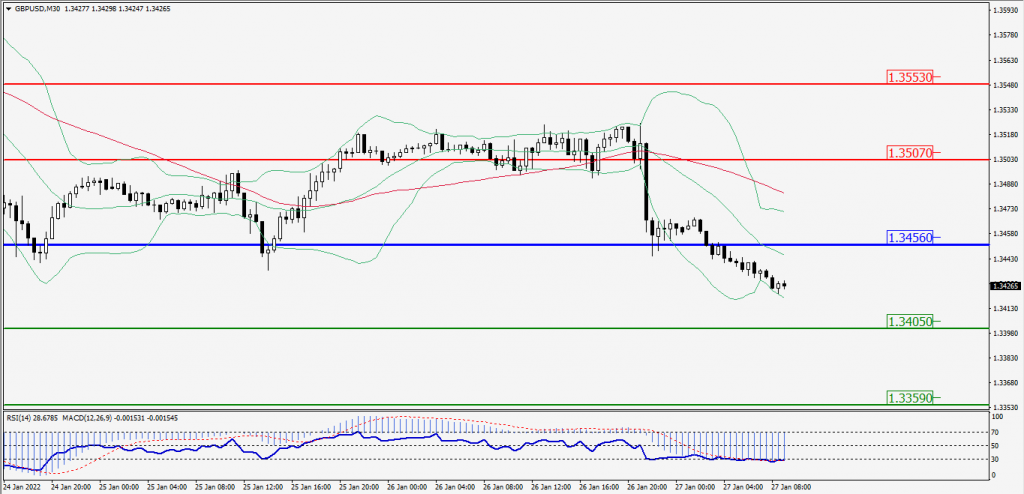
Green Lines Indicate Resistance Levels – Red Lines Indicates Support Levels
Light Blue is a Pivot Point – Black represents the price when the report was produced
USD/JPY Intraday: Trend on the Upside
Our pivot point is at 114.510
Preferable Price Action: Buy position Above pivot with the target at 114.910 and 115.240 in extension.
Alternative Price Action: The Downside breakout of the pivot would call for 114.110 and 113.780.
Comment: Pair Above its 55MA and MACD in positive territory.
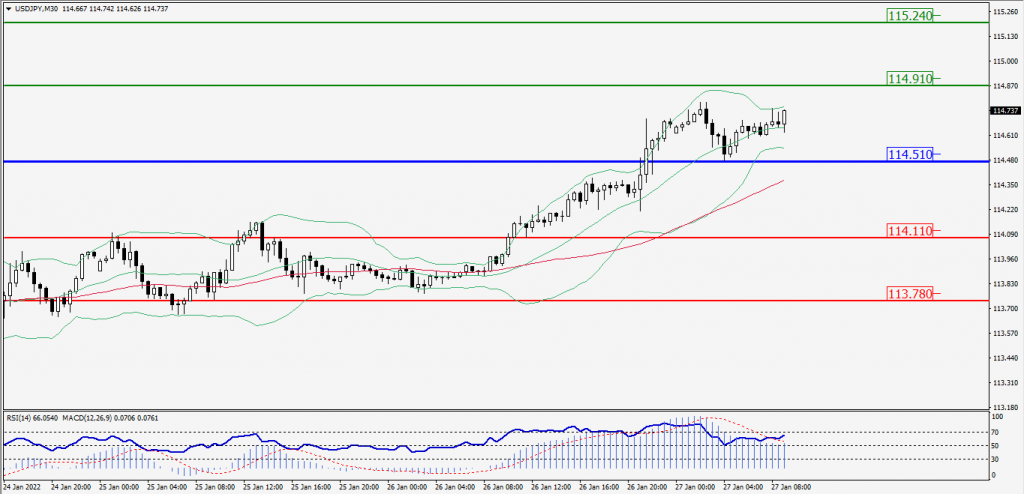
Green Lines Indicate Resistance Levels – Red Lines Indicates Support Levels
Light Blue is a Pivot Point – Black represents the price when the report was produced
AUD/USD Intraday: Major Downtrend
Our pivot point is at 0.71030
Preferable Price Action: Sell Positions below pivot with targets at 0.70390 & 0.69990 in extension.
Alternative Price Action: Above pivot looks for a further Upside with 0.71670 & 0.72070 as targets.
Comment: Pair Below 55MA & 20MA and RSI below 50 levels.
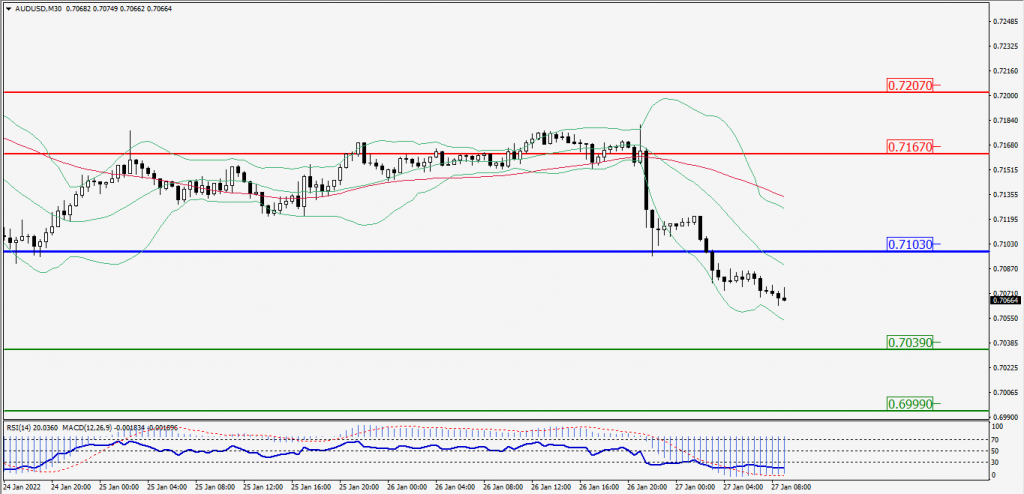
Green Lines Indicate Resistance Levels – Red Lines Indicates Support Levels
Light Blue is a Pivot Point – Black represents the price when the report was produced
CRUDEOIL Intraday: Trend on the Upside
Our pivot point is at 85.85
Preferable Price Action: Above pivots Buy Oil with 87.10 & 88.05 as targets.
Alternative Price Action: Sell crude Below pivot with targets at 84.60 and 83.65 in extension.
Comment: MACD is in the Neutral territory.
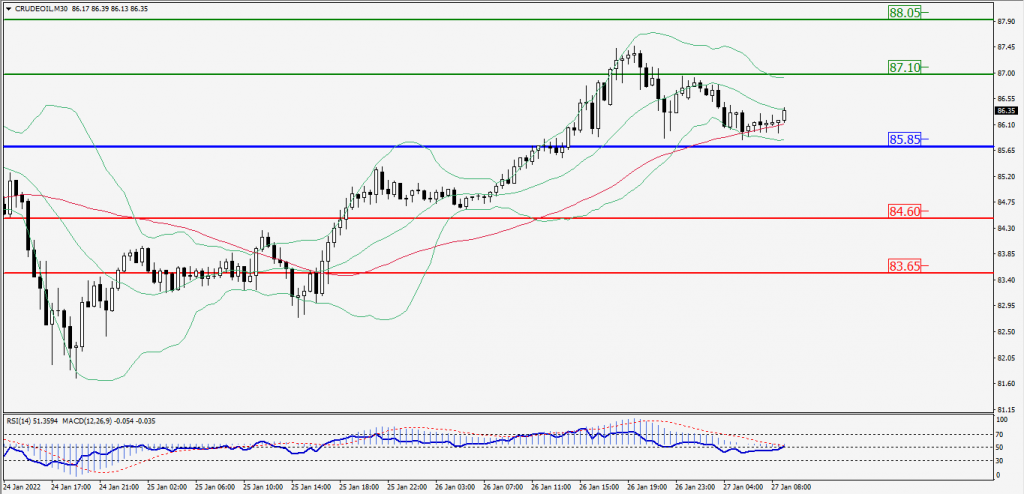
Green Lines Indicate Resistance Levels – Red Lines Indicates Support Levels
Light Blue is a Pivot Point – Black represents the price when the report was produced
XAU/USD Intraday: Major Down Trend
Our pivot point is 1821.70
Preferable Price Action: Further Downside to 1805.40 and 1792.90.
Alternative Price Action: If the price gives an Upside breakout of a pivot, then the price extends to 1838.00 and 1850.50.
Comment: MACD is a Negative territory And Price Below its 20MA & 55MA.
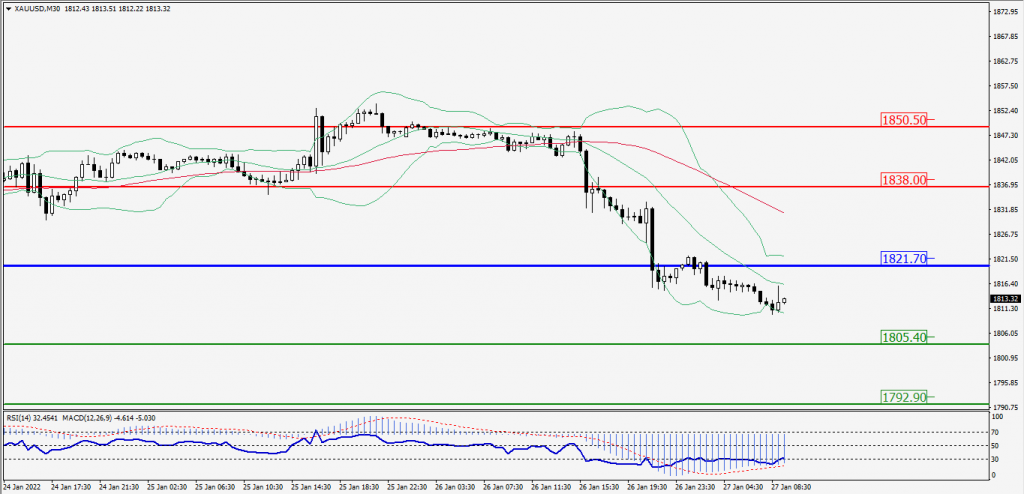
Green Lines Indicate Resistance Levels – Red Lines Indicates Support Levels
Light Blue is a Pivot Point – Black represents the price when the report was produced
Dow Jones Intraday: in a Consolidation Zone
Our pivot point is 34,270.00
Preferable Price Action: Take Short positions Below pivot with targets at 33,572.00 & 32,993.00.
Alternative Price Action: Above 34,270.00 looks for further Upside to 34,968.00 & 35,547.00.
Comment: RSI below 50 levels And price is below 55MA.
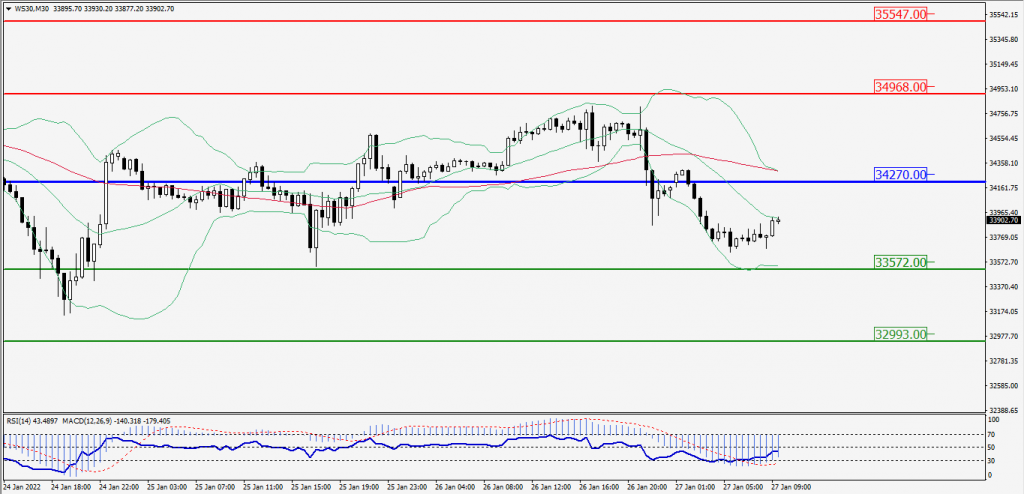
Green Lines Indicate Resistance Levels – Red Lines Indicates Support Levels
Light Blue is a Pivot Point – Black represents the price when the report was produced