Market Wrap: Stocks, Bonds, Commodities
Wall Street gyrated wildly on Friday, the S&P 500 once again narrowly avoiding correction confirmation at the end of a session marked by a rally, selloff and recovery as investors juggled positive economic news with mixed corporate earnings, geopolitical unrest and the prospect of a more hawkish Federal Reserve.
The S&P 500 Lost (0.54%) ended at 4,326.50 points, while the Nasdaq Composite fell 1.40% to 13,352.80. The Dow Jones Industrial was down flat 34,160.78.
MSCI’s index of Asia-Pacific stocks outside Japan is down 0.28%, to 754.13 levels. Australian index rose 2.19% to 6,988.10. Japanese Nikkei Index collects 2.09% to 26,717.34.
European stocks were negative on Friday, with the Stoxx Europe 50 Index down 0.97% to 4,144.35 Germany’s DAX stair down 1.17% to 15,342.28, and France’s CAC pull down 0.65% to 6,977.81, and U.K.’s FTSE 100 pulled lower 0.65% to 7,505.53.
Benchmark 10-year U.S. Treasury ascend as demand for safe assets gains again, today 10-year bond yields rose 1.03% to 1.827.
Oil prices eased on Friday after Brent crude hit a seven-year high above $90 a barrel, as the market balanced concerns about tight worldwide supply with expectations the US Federal Reserve will soon tighten monetary policy.
Spot Brent crude oil gained 0.33% to $88.46 per barrel. US West Texas Intermediate crude up 0.42% to $86.97 a barrel.
The yellow metal gold declines 0.09% to 1,791.50 dollars per ounce.
Market Wrap: Forex
The dollar consolidated gains on Friday and was on track for its biggest weekly rise in seven months as expectations of higher interest rates fuelled the U.S. unit’s gains versus rivals
Today, the U.S. dollar index measures the greenback against a trade-weighted basket of six major currencies, which is raised at 97.390.
The Euro US Dollar (EUR/USD) is a widely traded pair that is lost today. This left the pair trading around $1.11350.
The Japanese yen was strong against the U.S. dollar on Friday as the stock pulled. Today USD/JPY is rose 0.18% at the 115.540 level.
Another commodity-related currency negative against the U.S dollar, AUD/USD left 0.36% to 0.70060, and NZD/USD fell 0.32 to 0.65600 level.
EUR/USD Intraday: Trend on the Downside
Our pivot point is at 1.11850
Preferable Price Action: Take Short positions Below pivot level with targets at 1.11230 & 1.10710 in extension.
Alternative Price Action: Above pivot looks for a further Upside to 1.12470 & 1.12990.
Comment: Pair Below 55MA and RSI below 50 levels.
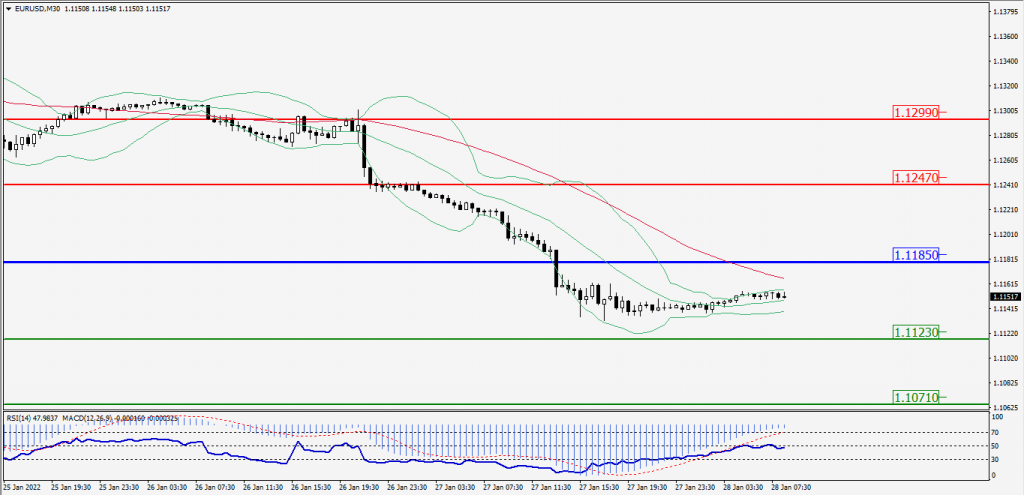
Green Lines Indicate Resistance Levels – Red Lines Indicates Support Levels
Light Blue is a Pivot Point – Black represents the price when the report was produced
GBP/USD Intraday: Major Down Trend
Our pivot point is at 1.34370
Preferable Price Action: Sell positions Below pivot with targets at 1.33790 & 1.33320 in extension.
Alternative Price Action: The price Above pivot would call for further Upside to 1.34950 & 1.35420.
Comment: RSI at 50 levels.
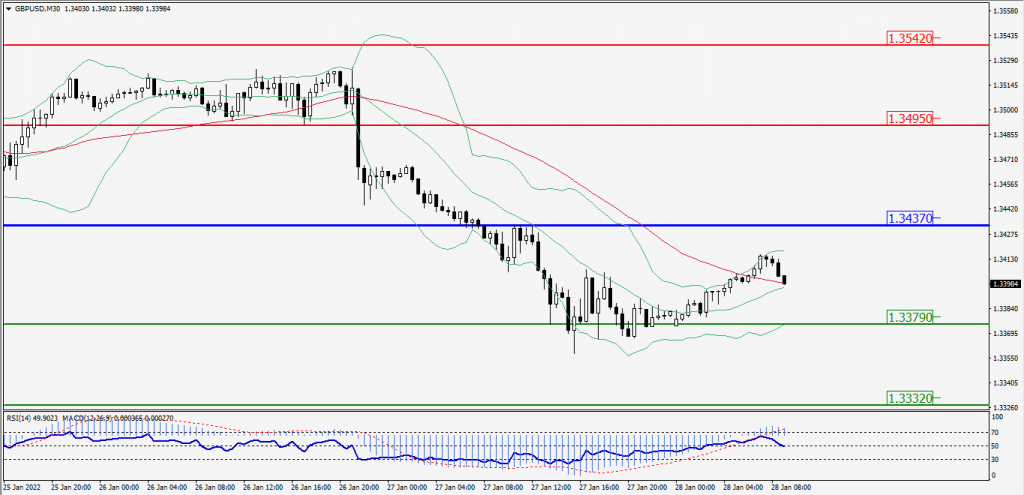
Green Lines Indicate Resistance Levels – Red Lines Indicates Support Levels
Light Blue is a Pivot Point – Black represents the price when the report was produced
USD/JPY Intraday: Trend on the Upside
Our pivot point is at 115.210
Preferable Price Action: Buy position Above pivot with the target at 115.750 and 116.120 in extension.
Alternative Price Action: The Downside breakout of the pivot would call for 114.670 and 114.300.
Comment: Pair Above its 55MA & 20MA and MACD in positive territory.
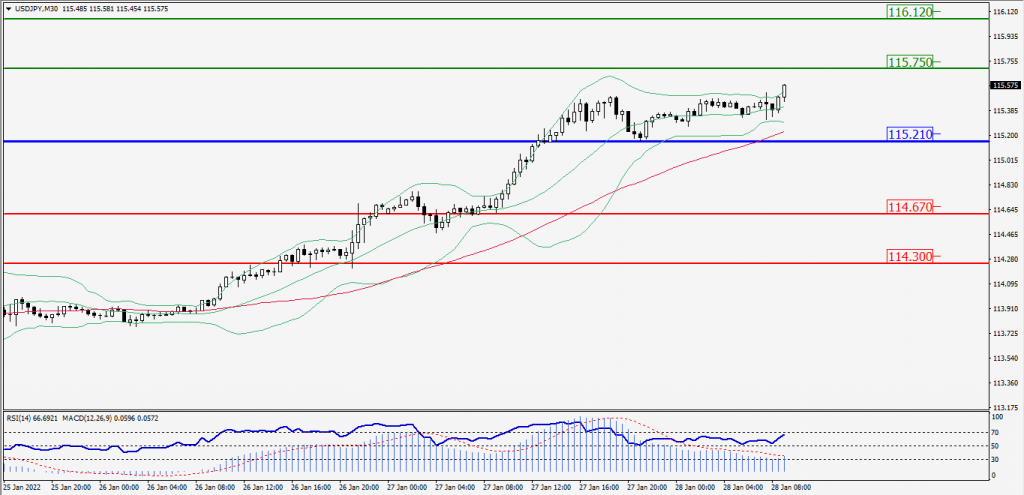
Green Lines Indicate Resistance Levels – Red Lines Indicates Support Levels
Light Blue is a Pivot Point – Black represents the price when the report was produced
AUD/USD Intraday: Major Downtrend
Our pivot point is at 0.70650
Preferable Price Action: Sell Positions below pivot with targets at 0.70020 & 0.69510 in extension.
Alternative Price Action: Above pivot looks for a further Upside with 0.71280 & 0.71790 as targets.
Comment: Pair Below its 55MA & 20MA and RSI below 50 levels.
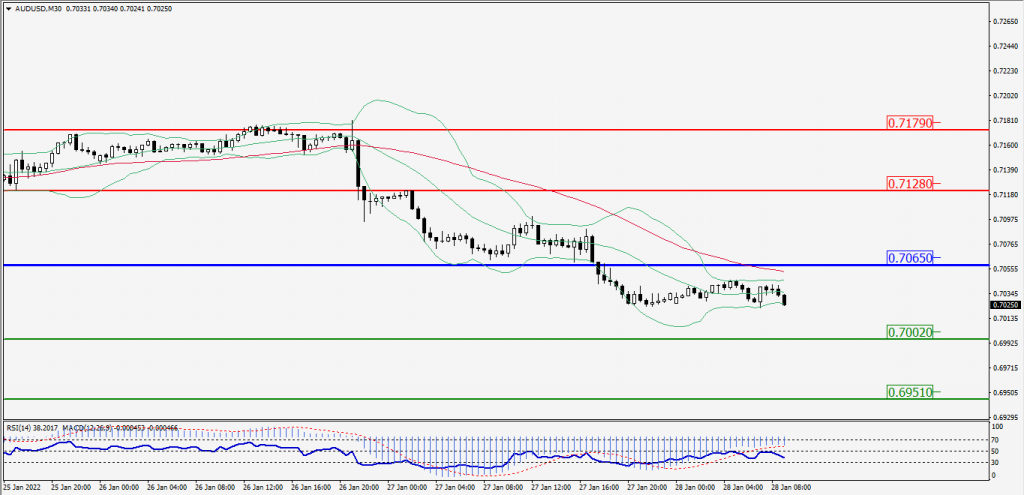
Green Lines Indicate Resistance Levels – Red Lines Indicates Support Levels
Light Blue is a Pivot Point – Black represents the price when the report was produced
CRUDEOIL Intraday: Support at 86.05
Our pivot point is at 86.05
Preferable Price Action: Above pivots Buy Oil with 87.55 & 88.45 as targets.
Alternative Price Action: Sell crude Below pivot with targets at 84.55 and 83.65 in extension.
Comment: MACD is in the Neutral territory.
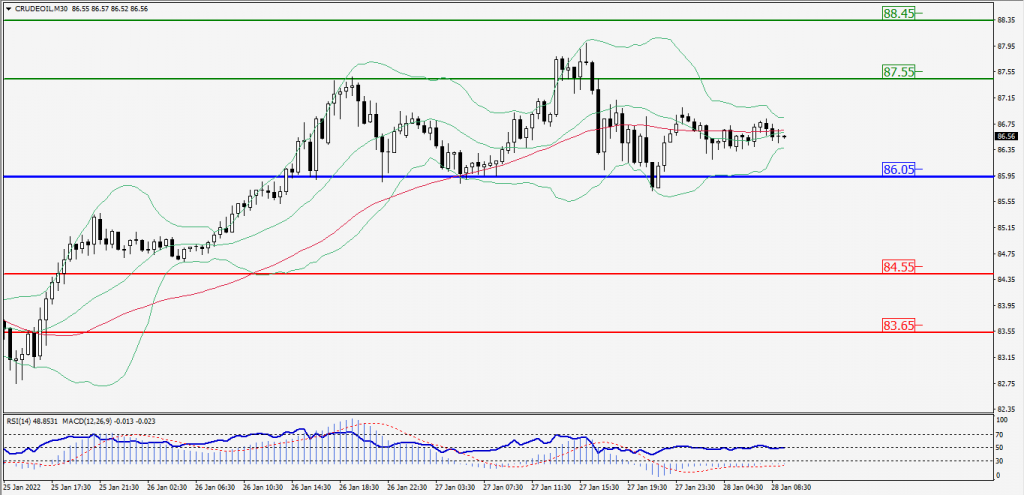
Green Lines Indicate Resistance Levels – Red Lines Indicates Support Levels
Light Blue is a Pivot Point – Black represents the price when the report was produced
XAU/USD Intraday: Major Trend on the Downside
Our pivot point is 1808.60
Preferable Price Action: Further Downside to 1788.90 and 1771.50.
Alternative Price Action: If the price gives an Upside breakout of a pivot, then the price extends to 1828.30 and 1845.70.
Comment: MACD is a Negative territory And Price Below 55MA.
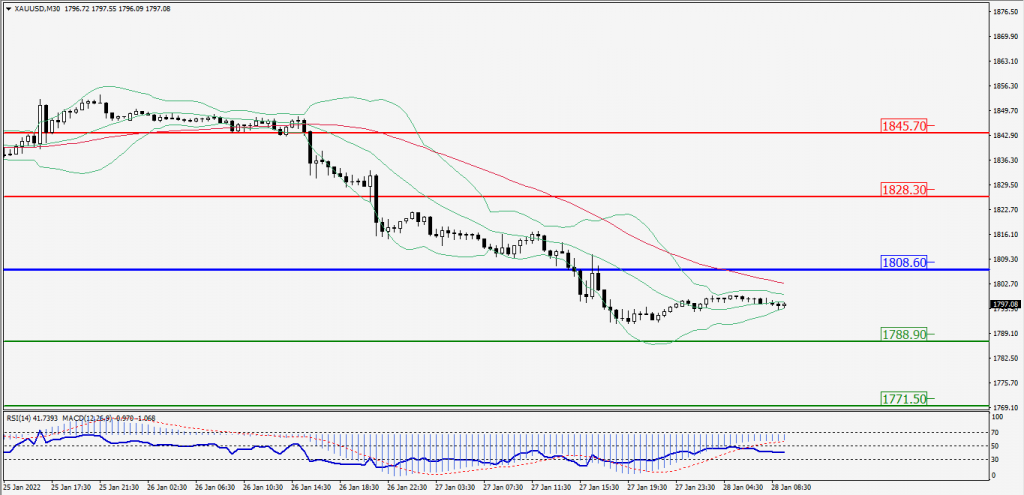
Green Lines Indicate Resistance Levels – Red Lines Indicates Support Levels
Light Blue is a Pivot Point – Black represents the price when the report was produced
Dow Jones Intraday: in a Consolidation Zone
Our pivot point is 33,979.00
Preferable Price Action: Take Long positions Above pivot with targets at 34,710.00 & 35,353.00.
Alternative Price Action: Below 33,979.00 looks for further Downside to 33,258.00 & 32,615.00.
Comment: RSI at 50 levels And price is Above 55MA.
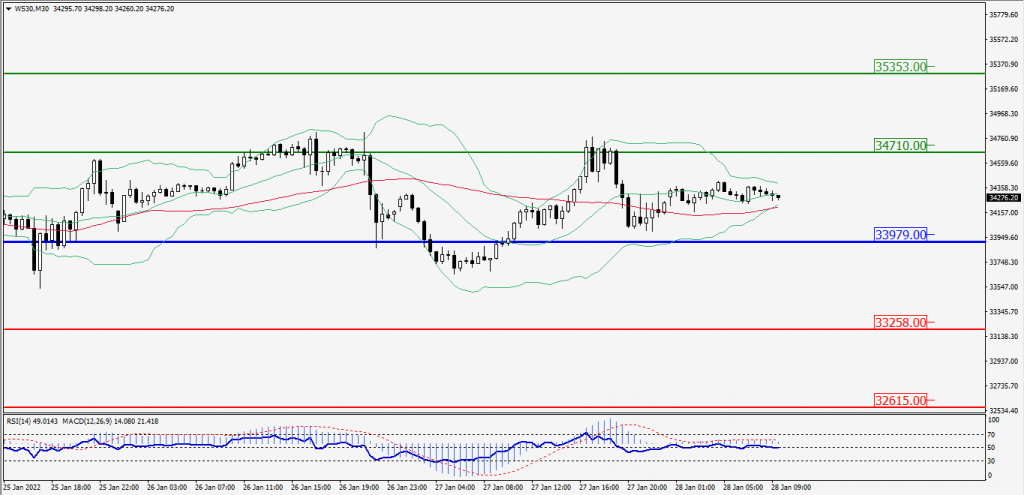
Green Lines Indicate Resistance Levels – Red Lines Indicates Support Levels
Light Blue is a Pivot Point – Black represents the price when the report was produced