Market Wrap: Stocks, Bonds, Commodities
Wall Street’s main indexes ended sharply lower on Monday as Netflix shares plunged after a weak earnings report, capping a brutal week for stocks that saw the S&P 500 and Nasdaq log their biggest weekly percentage drops since the onset of the pandemic in March 2020.
The S&P 500 Lost (1.89%) to end at 4,397.93 points, while the Nasdaq Composite fell 385.1 points (2.72%) to 13,768.90. The Dow Jones Industrial fell (1.30%) to 34,265.37.
MSCI’s index of Asia-Pacific stocks outside Japan is down 1.19%, to 786.24 levels. Australian index drop 0.51% to 7,139.50. Japanese Nikkei Index rose 1.11% to 27,522.26.
European stocks were negative on Monday, with the Stoxx Europe 50 Index fell 0.95% to 4,189.35 Germany’s DAX stair down 0.88% to 15,466.65, and France’s CAC fell 0.91% to 7,003.98, and U.K.’s FTSE 100 pulled down 0.48% to 7,458.34.
Benchmark 10-year U.S. Treasury ascend as demand for safe assets gains again, today 10-year bond yields lost to 0.07% to 1.746.
Oil prices jumped on Monday as geopolitical tensions in Eastern Europe and the Middle East heightened concerns about an already tight supply outlook, while OPEC and its allies continued to struggle to raise their output.
Spot Brent crude oil gained 0.40% to $87.43 per barrel. US West Texas Intermediate crude up 0.39% to $85.47 a barrel.
The yellow metal gold collected 0.54% to 1,841.65 dollars per ounce.
Market Wrap: Forex
The dollar was up on Monday morning in Asia, with the U.S. Federal Reserve’s latest policy decision due later in the week.
Today, the U.S. dollar index measures the greenback against a trade-weighted basket of six major currencies, which is raised at 95.740.
The Euro US Dollar (EUR/USD) is a widely traded pair that is lost today. This left the pair trading around $1.13220.
The Japanese yen was not strong against the U.S. dollar on Monday as the stock pulled lower. Today USD/JPY is down to 0.08% at 113.580 level.
Another commodity-related currency negative against the U.S dollar, AUD/USD dropped 0.38% to 0.71560, and NZD/USD fell 0.25% to 0.67040 level.
EUR/USD Intraday: In a Consolidation Zone
Our pivot point is at 1.13360
Preferable Price Action: Take Short positions Below pivot level with targets at 1.13080 & 1.12880 in extension.
Alternative Price Action: Above pivot looks for a further Upside to 1.13640 & 1.13840.
Comment: Pair Below its 20MA & 55MA and RSI below 50 levels.
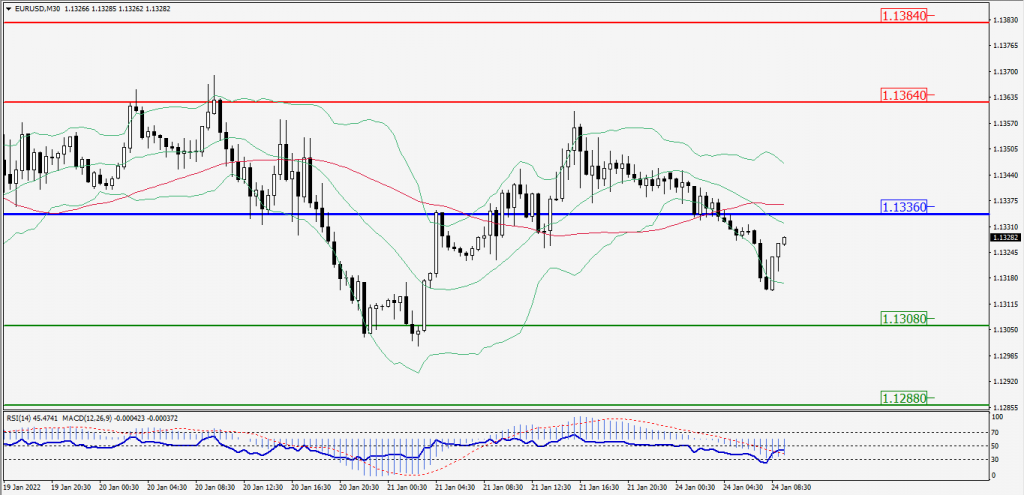
Green Lines Indicate Resistance Levels – Red Lines Indicates Support Levels
Light Blue is a Pivot Point – Black represents the price when the report was produced
GBP/USD Intraday: Major Resistance at 1.35640
Our pivot point is at 1.35640
Preferable Price Action: Sell positions Below pivot with targets at 1.35260 & 1.34890 in extension.
Alternative Price Action: The price Above pivot would call for further Upside to 1.36020 & 1.36390.
Comment: Pair Below its 20MA & 55MA and RSI below 50 levels.
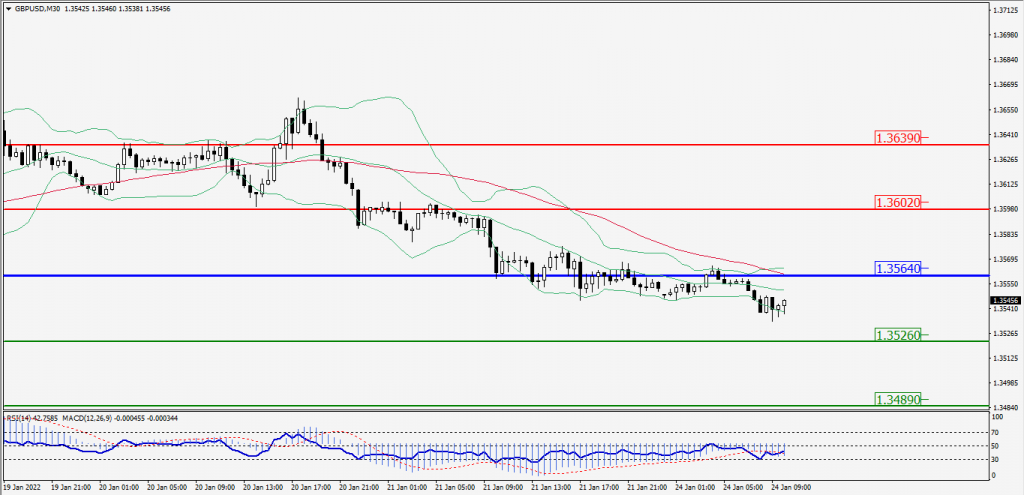
Green Lines Indicate Resistance Levels – Red Lines Indicates Support Levels
Light Blue is a Pivot Point – Black represents the price when the report was produced
USD/JPY Intraday: Trend on the Downside
Our pivot point is at 114.010
Preferable Price Action: Sell position Below pivot with the target at 113.510 and 113.100 in extension.
Alternative Price Action: The Upside breakout of the pivot would call for 114.510 and 114.920.
Comment: Pair Below its 55MA & 20MA and MACD in negative territory.
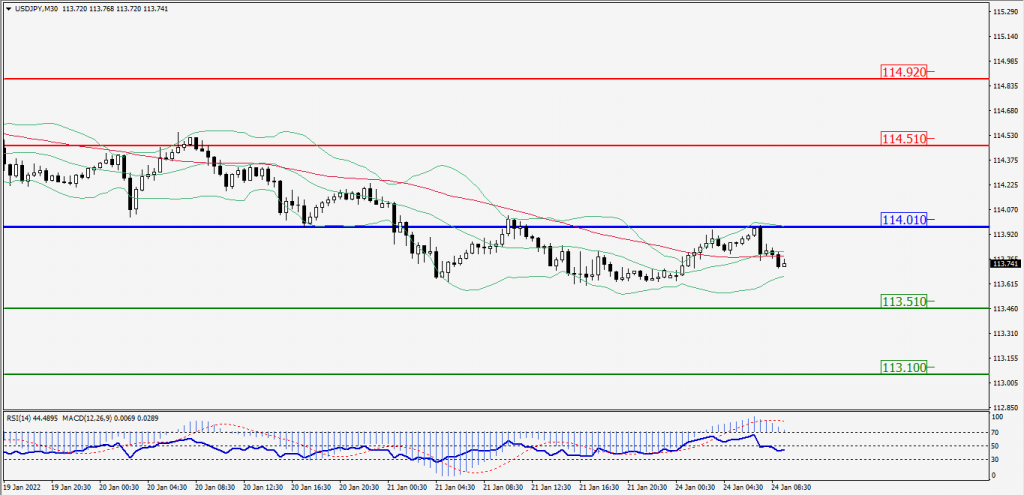
Green Lines Indicate Resistance Levels – Red Lines Indicates Support Levels
Light Blue is a Pivot Point – Black represents the price when the report was produced
AUD/USD Intraday: Trend on the Downside
Our pivot point is at 0.71890
Preferable Price Action: Sell Positions below pivot with targets at 0.71360 & 0.71010 in extension.
Alternative Price Action: Above pivot looks for a further Upside with 0.72420 & 0.72770 as targets.
Comment: Pair Below its 55MA & 20MA and RSI below 50 levels.
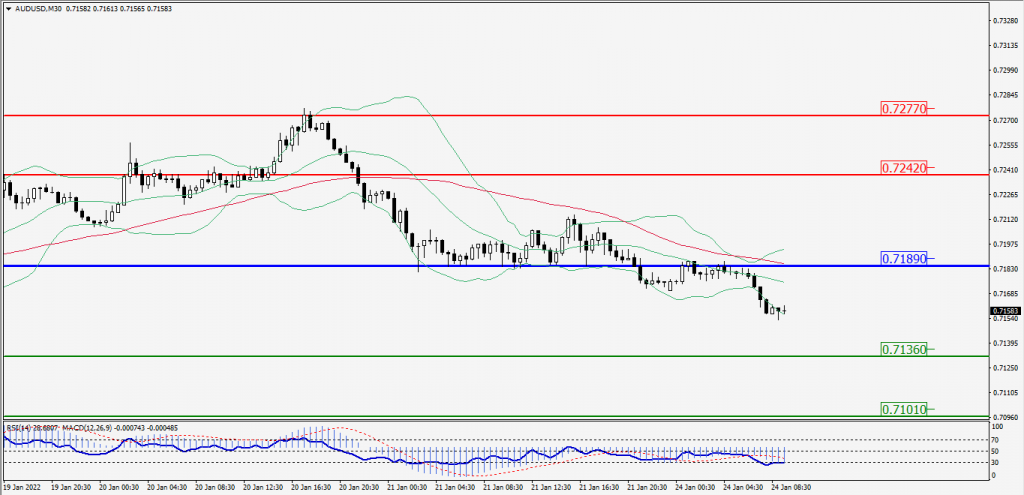
Green Lines Indicate Resistance Levels – Red Lines Indicates Support Levels
Light Blue is a Pivot Point – Black represents the price when the report was produced
CRUDEOIL Intraday: Major Support at 85.05
Our pivot point is at 85.05
Preferable Price Action: Above pivots Buy Oil with 86.35 & 87.50 as targets.
Alternative Price Action: Sell crude Below pivot with targets at 83.75 and 82.60 in extension.
Comment: Price Above 55MA and MACD is in the positive territory.
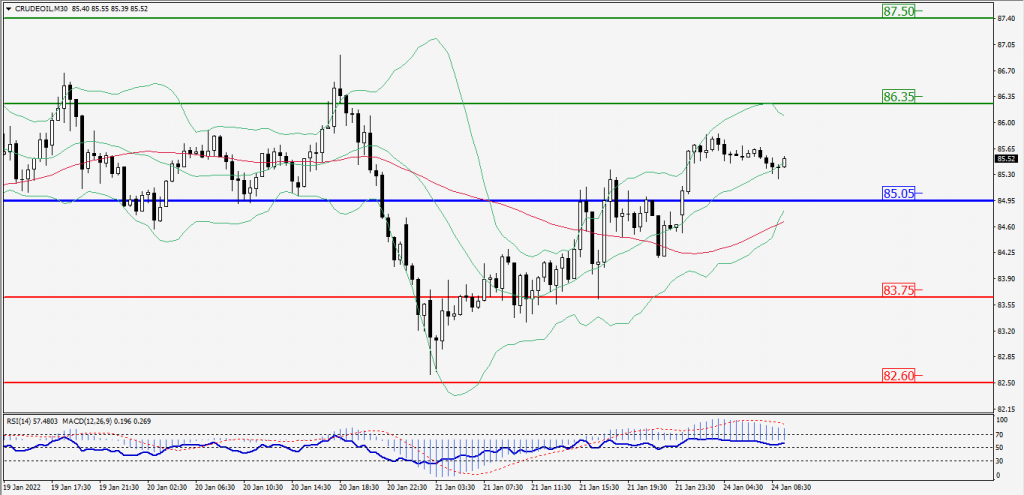
Green Lines Indicate Resistance Levels – Red Lines Indicates Support Levels
Light Blue is a Pivot Point – Black represents the price when the report was produced
XAU/USD Intraday: Major Trend on the Upside
Our pivot point is 1833.50
Preferable Price Action: Further Upside to 1842.60 and 1850.30.
Alternative Price Action: If the price gives a Downside breakout of a pivot, then the price extends to 1824.40 and 1816.70.
Comment: MACD is a Neutral territory And Price Above 55MA & 20MA.
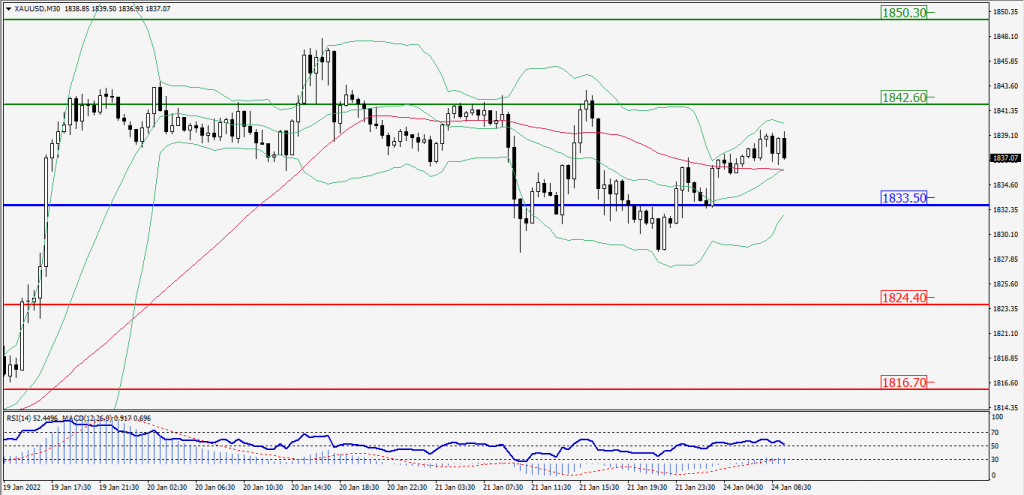
Green Lines Indicate Resistance Levels – Red Lines Indicates Support Levels
Light Blue is a Pivot Point – Black represents the price when the report was produced
Dow Jones Intraday: Trend on the Downside
Our pivot point is 34,750.00
Preferable Price Action: Take Short positions Below pivot with targets at 34,120.00 & 33,734.00.
Alternative Price Action: Above 34,750.00 looks for further Upside to 35,380.00 & 35,766.00.
Comment: RSI below 50 levels And price is Below 55MA.
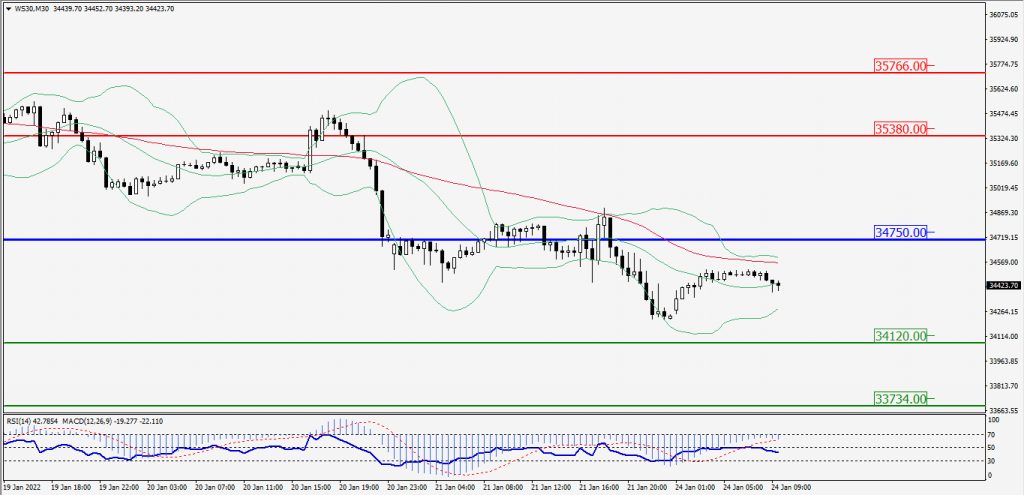
Green Lines Indicate Resistance Levels – Red Lines Indicates Support Levels
Light Blue is a Pivot Point – Black represents the price when the report was produced